The game PixelLunatic and I have been working on for the past seven months, Sanity Wars Reimagined, has been officially released! Download it here.
It’s been a long seven months, working on this game, and while there’s still plenty of things that could be improved, overall I’m pleased with how this game turned out. Most importantly, we learned many things that will prove useful for our future game development endeavors.
Note: If you implemented this pattern and are now experiencing issues with get_tree() calls, see my Issues with get_tree() section at the end of the article.
Oftentimes, in code, you need a way to have different parts of the codebase communicate with each other. One way to do this is have those components directly call methods from another component. While that works, it means you directly couple those components together. If you want to reuse one component in another project, you either have to take all the directly-coupled components with it or you have to refactor the direct couplings out of the component you want to reuse, neither of which is desirable from a clean code standpoint.
A way to solve this problem is to use the signal pattern. This is where each component can emit a named signal, and other components can then be connected to that signal. From that point on, whenever that signal is emitted by the component, anything that is listening for that signal can run code in response to that emission. It’s generally a great pattern, allowing for code to indicate when some event, or signal, happens, and for other parts of code to respond to that event accordingly (without code directly relying on calling methods from one another).
There is a third way to have decoupled components communicate to one another: the messenger pattern. At surface level, it’s very similar to the signal pattern: a part of your code dispatches a named message, and any code that is listening for that particular message can respond to it. Those different parts of your code aren’t connected to one another, however; instead, they interact through a Messenger node. Code that wants to listen for a message registers a message listener to the Messenger, and when another part of code dispatches a message with that name, the Messenger loops through all the registered listeners for that message name and invokes their callback functions.
Both the signal pattern and the messenger pattern can be considered subsets of the Observer pattern. The key difference is that the signal pattern has many objects connecting to one (the object emitting the signal), while the messenger pattern has a mediator object through which messages are dispatched and listened for by other objects. Which is better? It depends on what you are trying to accomplish architecturally, and there’s no reason you can’t use both.
Let’s discuss specifics, with relation to what Godot uses. Godot has the signal pattern baked into it at the core. Nodes can define signals through use of the signal keyword. Any node that wants to listen for another node’s signal can connect() to that node’s signal and associate a callback function to it. It looks like this, at a simplified level:
# OrdinaryNode
extends Node
signal some_cool_thing

# DifferentNode
extends Node

func _ready():
  # Assuming both OrdinaryNode and DifferentNode are children of a hypothetical parent node.
  get_parent().get_node('OrdinaryNode').connect('some_cool_thing', self, '_do_something_awesome')

func _do_something_awesome():
  print("This is awesome!")
From then on, whenever OrdinaryNode emits the some_cool_thing signal, the _do_something_awesome() function in DifferentNode will run, printing “This is awesome!”
While this is a good implementation of signals, the nature of how the signal pattern works implies some shortcomings. For instance, all signals must be explicitly defined in code. You can’t have OrdinaryNode, as written above, emit a coffee_break signal because the code didn’t explicitly define that such a signal exists. This is by design, as it means you have to plan what your node can and can’t emit. Sometimes, though, you do want to have a more flexible way to communicate with other nodes, and at that point signals can’t help you. This is one thing the messenger pattern can help with, by not requiring you to explicitly define what messages can or can’t be sent.
Another aspect of the signal pattern is that it requires you to have nodes define a connection to the node emitting the signal if you want those nodes to react to the signal. That means those nodes must, by definition, couple themselves to the node emitting the signal (though the emitter node doesn’t know, or care, about those couplings). This isn’t necessarily bad, but it limits how you can architect your code; you have to make sure nodes that need to listen for a specific signal are able to connect to the node emitting said signal. Conversely, using the messenger pattern, you can have nodes connect only to a single Messenger node, which can be simpler to implement.
Godot does not natively implement such a messenger node, however. If we want to use this messenger pattern, we’ll need to make something ourselves. That’s what this tutorial will be about.
Note: What I’m calling the Messenger Pattern is more commonly known as the Mediator Pattern. I came up with the name Messenger before I learned what it is called, and I’ll continue to use it in this tutorial because I think it communicates more clearly what I’m using it for.
Setting Up
There is a sample project, if you want to refer to the finished product.
If you want to code alongside the tutorial, start by creating a new Godot project, then create a GDScript file named Messenger.gd. We’ll make this as the base file that other implementations of messengers can extend to provide their own functionality.
The original project was created in Godot 3. Here is a branch that is configured for Godot 4. (Thanks to valVk for assisting the Godot 4 conversion!)
Adding and Removing Listeners
The first thing we want to do is provide a way to add and remove message listeners. Let’s begin with adding listeners.
var _message_listeners := {} # Stores nodes that are listening for messages.


# Add object as a listener for the specified message.
func add_listener(message_name: String, object: Object, method_name: String) -> void:
  var listener = { 'object': object, 'object_id': object.get_instance_id(), 'method_name': method_name }

  if _message_listeners.has(message_name) == false:
    _message_listeners[message_name] = {}

  _message_listeners[message_name][object.get_instance_id()] = listener
This is fairly straightforward. We take the name of the message, the object that has the callback function, and the name of the callback. We store all that in a listener dictionary (defined as a class property outside of the function) and store it in _message_listeners in the dictionary stored at the key matching the message name (creating a dictionary for that key if it doesn’t already exist). We key this listener in the message_name dictionary to the object’s instance id, which is guaranteed to be unique.
Since Godot implements signals at the object level (Node inherits from Object), I’ll be typing these as Objects rather than Nodes, which allows for any node inheriting from Object to be used as a listener (including Resources).
Next, the ability to remove a registered listener.
# Remove object from listening for the specified message.
func remove_listener(message_name: String, object: Object) -> void:
  if not _message_listeners.has(message_name):
    return

  if _message_listeners[message_name].has(object.get_instance_id()):
    _message_listeners[message_name].erase(object.get_instance_id())

  if _message_listeners[message_name].empty():
    _message_listeners.erase(message_name)
Again, fairly straightforward. We run existence checks to see if a listener exists at that message_name key, and erase it from the dictionary if so. Additionally, if no more listeners exist for that message_name, we erase the dictionary for listeners of that message name.
Sending Messages
Now that we can add and remove message listeners, it’s time to add the ability to send those messages.
# Sends a message and triggers _callbacks on its listeners.
func dispatch_message(message_name: String, data := {}) -> void:
  var message = { 'name': message_name, 'data': data }

  _process_message_listeners(message)
We take a message_name string and a data dictionary (which defaults to be an empty dictionary), store it to a message variable, and pass that variable into _process_message_listeners.
# Invoke all listener callbacks for specified message.
func _process_message_listeners(message: Dictionary) -> void:
  var message_name = message.name

  # If there aren't any listeners for this message name, we can return early.
  if not _message_listeners.has(message_name):
    return

  # Loop through all listeners of the message and invoke their callback.
  var listeners = _message_listeners[message_name]
  for listener in listeners.values():
    # Invoke the callback.
    listener.object.call(listener.method_name, message.data)
This is where we handle triggering the callbacks for a message listener. If there aren’t any listeners for that message name, we return early to avoid doing further processing. If there are listeners for that message name, then we loop through each one and trigger the stored method callback, passing in the message’s data dictionary.
That’s it, as far as the basic implementation goes. But there are a couple of caveats that need to be dealt with.
Dealing with Nonexistent Listeners
One such case happens when a listener’s object is freed, making the stored reference in the listener dictionary invalid. If you try to operate on it, Godot will crash, so we need to provide a way to scan for dead listeners and remove them from storage.
Let’s start with a function to perform both the check and the purge:
# Removes a listener if it no longer exists, and returns whether the listener was removed.
func _purge_listener(listeners: Dictionary, listener: Dictionary) -> bool:
  var object_exists = !!weakref(listener.node).get_ref() and is_instance_valid(listener.node)

  if !object_exists or listener.node.get_instance_id() != listener.node_id:
    listeners.erase(listener.node_id)
    return true

  return false
Multiple checks are used to see if the object exists (I’ve found in practice that I’ve needed both of these, not just one or the other). We also check to see if the instance id of the stored listener matches the id of the listener object we passed in; honestly, I can’t recall when or why that particular scenario occurs (I sadly forgot to write a comment about it in my code), but I know I’ve encountered it in the past, so I continue to include it as part of my check. If the object doesn’t exist, or the ids don’t match, we conclude the listener’s object no longer exists, and thus remove the listener from storage. Finally, we return a boolean value indicating whether the purge was performed or not.
Now we need to modify our existing code to use this function.
func _process_message_listeners(message: Dictionary) -> void:
  # ...existing logic

  for listener in listeners.values():
    # If the listener has been freed, remove it
    if _purge_listener(listeners, listener):
      # Check if there are any remaining listeners, and erase the message_name from listeners if so.
      if not _message_listeners.has(message_name):
        _message_listeners.erase(message_name)
        return
      else:
        continue

    # ...existing logic
The difference is we call _purge_listener before we try to invoke the callback. If the listener was purged, we perform an additional check to see if there are any other listeners of message_name, and erase the dictionary keyed to message_name if there aren’t; otherwise, we proceed to the next listener in the for loop.
That takes care of dead listeners. There’s one more problem we need to address.
Dispatching Messages Too Early
Right now, if we try to send and listen for messages during the ready process (when Godot’s nodes all run their _ready callbacks), then we’ll likely run into issues where messages are dispatched before the listeners of those messages are registered (because their ready callbacks run later than when the messages are sent). To solve this, we’re going to add a message queue. If a message is being dispatched before the root node of the scene tree is ready, we’ll add the message onto this queue, and once the root node emits its ready signal we’ll process all the messages in the queue.
Let’s start with setting up the message queue, and modifying our dispatch_message function.
var _message_queue := [] # Stores messages that are being deferred until the next physics process tick.
var _messenger_ready := false # Is set to true once the root node is ready, indicating the messenger is ready to process messages.

# Sends a message and triggers _callbacks on its listeners.
func dispatch_message(message_name: String, data := {}) -> void:
  var message = { 'name': message_name, 'data': data }

  if _messenger_ready:
    _process_message_listeners(message)
  else:
    _message_queue.push_back(message)
We’ve added two new class properties, one to house the message queue and the other to mark when the messenger node considers itself ready. dispatch_message has been modified to first check _messenger_ready, and if so it runs the code the same as before. If the messenger node is not ready, then the message is pushed onto the message queue.
Now let’s set up the ability to process the message queue.
func _ready() -> void:
  get_tree().get_root().connect('ready', self, '_on_Root_ready')


# Is called when the root node of the main scene tree emits the ready signal.
func _on_Root_ready() -> void:
  _messenger_ready = true
  _process_message_queue()


# Process all messages in the message queue and reset the queue to an empty array.
func _process_message_queue() -> void:
  for message in _message_queue:
    _process_message_listeners(message)

  _message_queue = []
In Messenger’s own _ready callback, we register a listener to the scene tree root’s ready signal. The callback then sets _messenger_ready to true and calls a function, _process_message_queue(), which loops through each message in the queue and calls _process_message_listeners() on them. At the send, we clear the message queue, since we don’t need (or want) to process these messages again.
Creating a GlobalMessenger
At this point, we have a base Messenger class that can be used anytime we want to implement the messenger pattern in our code. Let’s demonstrate this by creating a global singleton, GlobalMessenger, that we can interact with from anywhere in our codebase.
Start by creating a new file, global_messenger.gd, and have it extend our Messenger class. If Godot claims the Messenger class doesn’t exist, then you’ll need to reload the project to force Godot to update itself and recognize the Messenger class we added in Messenger.gd.
# Creates a global messenger that can be accessed from anywhere in the program.
extends Messenger
The reason I made this file name snake_case is because my personal convention is to name files that are solely used as singletons with this format, to distinguish them from files containing extensible classes. This is my personal preference only, and is not required to make this code work.
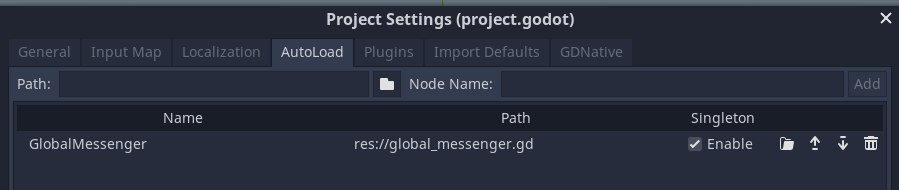
That’s all that needs to be done from a code standpoint. To make this a globally-available singleton, we need to go to Project -> Settings in the editor menu, navigate to the AutoLoad tab, and add global_messenger.gd to the list of autoloaded files.
And…that’s it! We now have a global singleton that we can use from anywhere in our codebase to dispatch messages!
Deferring Messages
Let’s add some additional functionality to our global messenger. For instance, right now, once the messenger is ready, we immediately run listener callbacks upon receipt of the message. What if we wanted to defer message dispatches until the next process tick? It might prove useful to ensure all game data is updated by the time your message callbacks are being run.
We already have a message queue that is used to make sure messages are deferred until the messenger is ready. We can build on that to add functionality to intentionally defer message dispatching until the next physics process tick.
func _ready() -> void:
  set_physics_process(false)


func _physics_process(_delta) -> void:
  ._process_message_queue()
  set_physics_process(false) # We don't need to keep updating once messages are processed.


# Queues a message to be dispatched on the next physics processing tick.
func dispatch_message_deferred(message_name: String, data := {}) -> void:
  _message_queue.push_back({ 'name': message_name, 'data': data })

  set_physics_process(true)
First, we use _ready() to disable physics processing. That’s because, whenever _physics_process() is defined in a script file, Godot automatically enables processing. We only want to process when there are messages in queue, so we just disable physics processing right off the bat.
I use _physics_process instead of _process to ensure messages are processed at a consistent rate. physics_process is run a consistent amount of times per second, whereas _process is run as often as possible, and I’ve found that having messages processed as fast as possible can result in unexpected complexity when sent from code that is expecting a consistent frame rate.
Next, in the _physics_process() callback, we call _process_message_queue(), then disable physics processing again (basically, only running the update step a single time).
Finally, we create a new function, dispatch_message_deferred, making it obvious that calling this will be different from a regular message dispatch. We add the message straight onto the message queue. Afterwards, we set the physics processing step to be true. This way, the next time _physics_process() callbacks are run in the code, the global messenger’s _physics_process() callback will be run, too. And since it is a global singleton, it will be run before other nodes in the root scene.
That’s it!
Testing our Implementation
Now that we have a Messenger node, and a GlobalMessenger implementation of it, let’s set up a test scene in our project to test their functionality and make sure they work as intended.
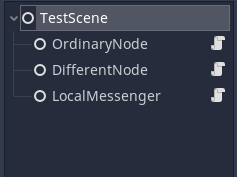
Create a new scene, TestScene, then structure it thusly:
LocalMessenger is a node which is extended from Messenger; we will use this to test that a locally-built implementation of our messenger node works.
The other two nodes, OrdinaryNode and DifferentNode, should contain the following code:
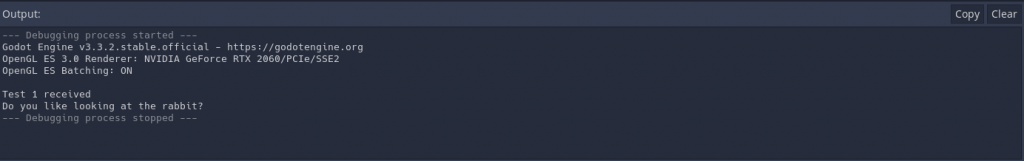
At this point, if you run the scene, you should see the two messages printed to console. If you do, then everything was set up correctly!
Issues with get_tree()
Recently (in May 2023), I encountered a strange bug where a message callback that invoked get_tree() was not returning the scene tree, despite the node housing the callback function being in the scene tree. After some investigation, I realized that I was calling the add_listener() function from the node’s _ready() callback; when I switched to adding the listener in _enter_tree() and removing it in _exit_tree() the get_tree() call worked as expected.
I admittedly am not entirely sure why this works, but my theory is that adding the listener during _ready() is either storing the reference to the function call when the tree is not yet defined or subsequent tree exits and enters is causing the reference to be lost. In any case, I wanted to add this addendum in case anyone else chose to implement this pattern and ran into the same problem.
If you happen to know more info about why this might have happened, please let me know!
Conclusion
We now have a base Messenger node, as well as a GlobalMessenger singleton that extends it and adds defer functionality to it. When should it be used? Personally, I use the messenger pattern in cases where I want to enable node communication, but for whatever reason it doesn’t benefit me to define the specific signals ahead of time, which is when the messenger’s dynamism comes into play.
Of course, that dynamism leads to the risk of making messy code. One advantage to explicitly forcing signals to be defined is that it forces you to think about how you are architecting your code, by making you think clearly about how your signals are going to be used. Since Messenger lets any node send whatever message it wants, it falls on you to make sure that power isn’t abused to send messages when the situation doesn’t call for it. For instance, if you have one node which you want other nearby nodes to listen for a specific event from, you don’t need the dynamic nature of Messenger; signals work perfectly fine, and are a cleaner way to get the job done.
As with all things, in life and code, consider carefully how you do things, and use whatever tools and patterns best fit your needs.
I’ve been playing Metroid Dread recently (with one finished playthrough under my belt). It’s the first Metroid game I’ve played (though I’ve played other Metroidvanias), and I absolutely enjoyed it. There are many mechanics that I found fun: the combat is simple, yet engaging; the various abilities you unlock are interesting and lead to great gameplay moments; the level design both helps you avoid getting too lost and still lets you feel like you can explore and discover new areas; and the boss battles are tough, yet fair.
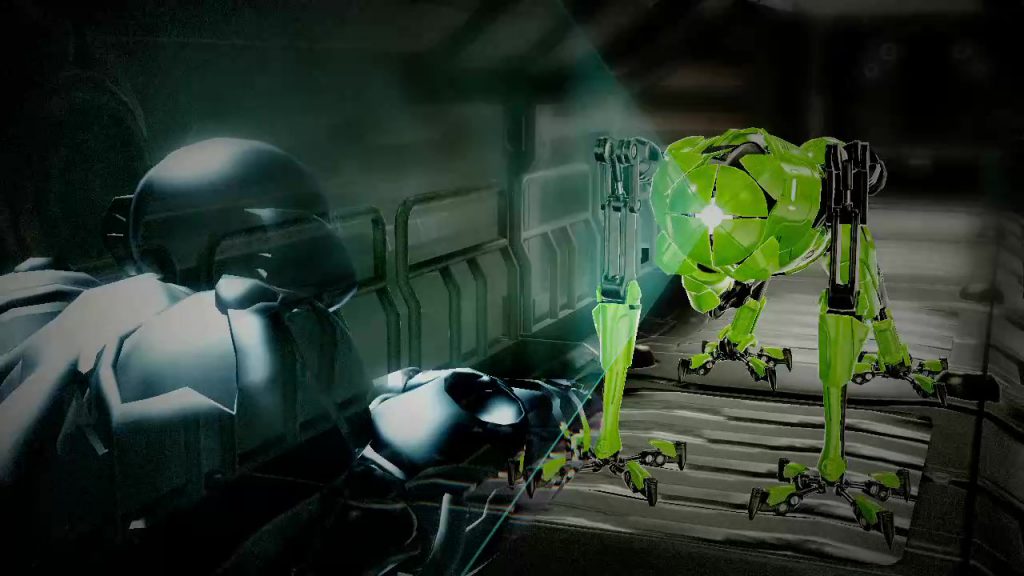
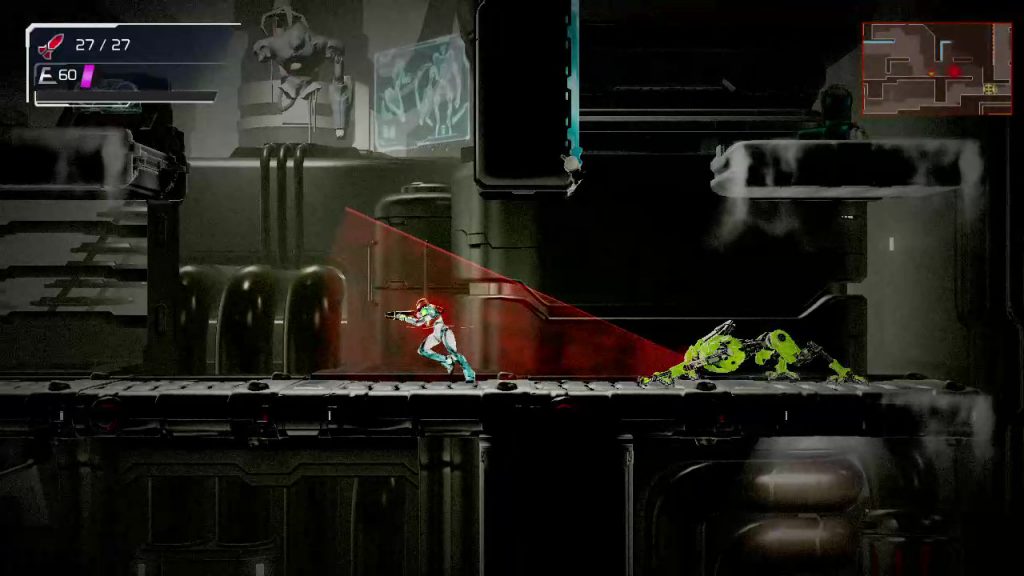
The flagship mechanic, the one that Nintendo advertised heavily, are the EMMI zones. These are designated sections of a map patrolled by a powerful EMMI robot, whose sole purpose is to hunt you down. Your normal weapons can’t hurt the EMMI, so you have to avoid encountering them while moving through their territory. If an EMMI catches you, it kills you unless you succeed on a low-probability counter move. There’s only one way to stop an EMMI for good: finding the energy to power your Omega Cannon, the one weapon you have that can damage them.
EMMI Zones present an action-oriented take on stealth gameplay, and I think they pull the job off well. They’re designed to give you a challenge that you can’t blast your way through, and are crafted such that they don’t put you through too much of their gameplay. In this blog post, I want to examine EMMI zones in two ways: how the game teaches you about the zones, and what mechanics are used to make the zones work.
Note: There will be discussion of some of the abilities you earn throughout the game, though there won’t be any spoilers about the game’s story.
How the Game Teaches You About EMMI Zones
Looking at EMMI zones as a whole, there’s a lot to consider, and it can be a little complex. Metroid Dread spends a good deal of time in the early parts of the game guiding you through the gameplay, using a combination of in-game cutscenes, scripted gameplay, and overt tutorialization. Through these approaches, the game allows you to get used to how EMMI zones work, while still having fun along the way.
The First EMMI Zone
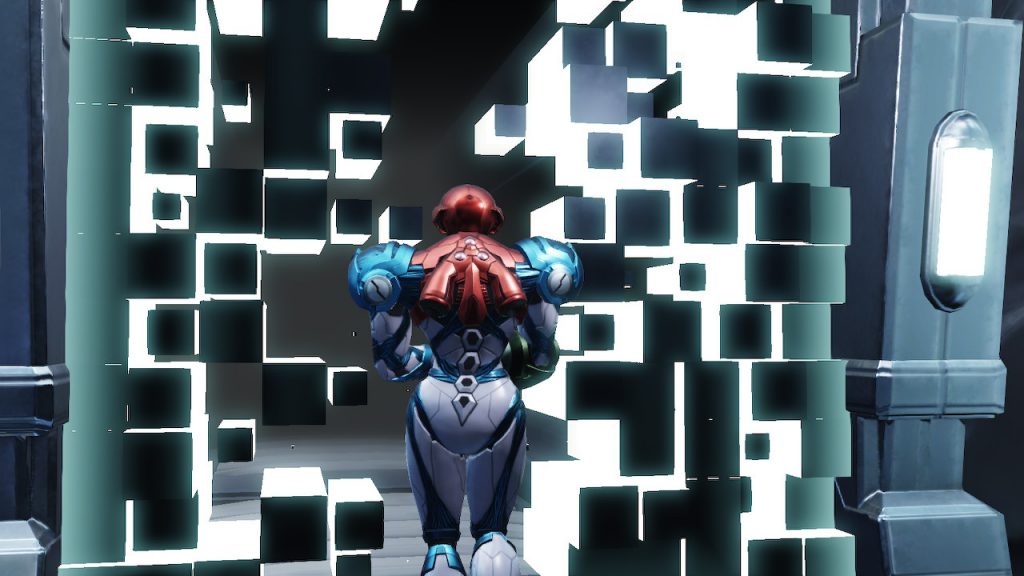
When you first encounter an EMMI, you are shown a cutscene, after which you are given a moment to try and respond to it with what limited abilities you have. The door behind you doesn’t open, and your normal beam weapon and missiles cause no damage to the robot. You are powerless to stop the EMMI from capturing you. At the moment of capture, however, the game pauses, explaining that you have a chance to try and parry the EMMI before it lands a killing blow, and waits to resume until you press the melee counter button. The EMMI freezes in response to this parry, and you are told that you can slide beneath a stunned EMMI. This sequence teaches you what happens when an EMMI catches you, and that you are not powerless to respond to it.
The EMMI recovers from the stun, and you are left to figure out how to run from it. In the next room, the level is designed with a tall wall and platform that you can bounce up and escape. The EMMI is damaged, so even though it tries to follow you, it cannot. The fact that it tries, however, suggests that this is what the other EMMI robots will try to do.
In the very next room is the Omega Cannon, the weapon you need to destroy the EMMI. First, you get a tutorial that teaches you how the Omega Cannon’s charge blast works, by forcing you to use it to open an exit out of the room. Afterwards, you drop back down to face the EMMI, and you have to use the cannon to destroy it and continue on your way.
The Second EMMI Zone
The next EMMI zone is right next to the first one, so you get a chance to try a less hand-held version of EMMI zone gameplay. It starts with a cutscene that reinforces the fact that your normal weapons don’t work against the EMMI (in case you hadn’t realized that, yet). You then have to escape from the EMMI; however, unlike the first one, this EMMI isn’t damaged, so simply climbing up a wall is not enough. You have to evade the EMMI through multiple rooms long until it loses sight of you. This causes it to leave pursuit mode, allowing the EMMI zone doors to unlock and giving you the chance to get out.
From that point, the game leaves you alone, letting you explore more of the world, discovering some new powers and augmentations along the way. The level design forces you to cross back through the EMMI zone multiple times to get to the places you need to go, giving you plenty of experience avoiding the EMMI.
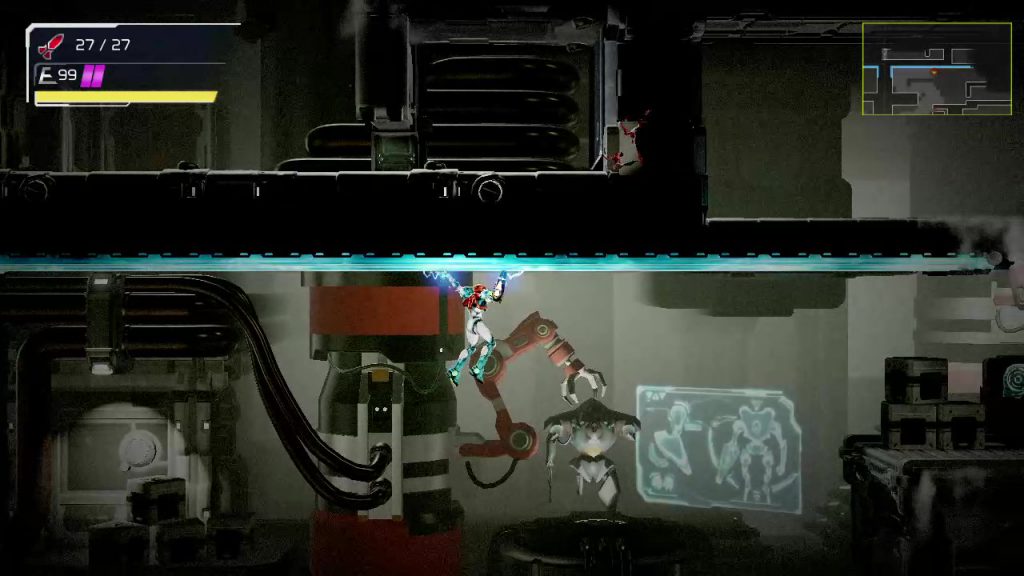
Eventually, you encounter the first Central Unit room, the place where an entity coursing with Omega Energy (the resource that powers your Omega Cannon) is housed. You have to battle this Central Unit, dodging two attacks while blasting the Central Unit with missiles to take down its armored shell and squishy body. Finally, the entity dies, allowing you to siphon its Omega Energy to power the cannon. This time, you are given a second facet to the Omega Cannon: a rapid-fire blast.
As with the first room, the game locks you into the Central Unit’s room and forces you to use your Omega Cannon’s abilities to break out of it. You have to use the rapid-fire to melt the exit door’s heat shield, exposing it to a charge blast which blows it open. This same combination is what you use to defeat the EMMI. This time, when the EMMI dies, you acquire an ability from it, hinting that future EMMI will do the same.
The last major aspect of EMMI zone gameplay comes after you defeat the game’s first boss, where you acquire the Phantom Cloak ability. This turns you invisible for a short period of time. A short briefing explains how the Phantom Cloak can be used to hide yourself from EMMI detection, which is reinforced by a short cutscene when you enter the next EMMI zone, where Samus goes undetected by the next EMMI when she employs the Phantom Cloak.
At this point, you’ve been given the abilities you need to handle any challenge the EMMI zones can throw at you. Along the way, the game gave you a tour of how gameplay within EMMI zones will work, both teaching you through tutorial and allowing you to experiment and try things for yourself.
How do those abilities come together with the rest of the game design to give great gameplay? That’s what I want to examine next.
The Design of EMMI Zone Gameplay
The bulk of gameplay in Metroid Dread consists of exploration, small enemy encounters, and boss fights. Lots of action, lots of things to discover, lots of abilities to unlock progression to other parts of the world. Compared to this run-and-gun style of gameplay, EMMI zones feel tense. You can’t blast your way out of the problem; you have to plan your next moves carefully, with the occasional rapid, improvised escape. This is a good change-up in gameplay, giving you a different style of experience; at the same time, it doesn’t last too long, so you don’t spend too much time under tension, helping you avoid becoming fatigued.
Let’s take a look at the various components which power this experience: level design, evasion, and encounters.
Level Design
There is plenty of great map design in Metroid Dread. Seemingly impossible paths are unlocked by new abilities you discover, clever use of one-way gating keeps you from getting too lost, and many skillful sections conceal power-ups to reward conquering the challenge.
Likewise, the EMMI zones are carefully designed, not just in and of themselves, but also with respect to supplementing the rest of the map design. Each zone is placed on the map such that you are forced to cross through multiple times to accomplish your other goals. At the same time, the EMMI zones are only one part of a larger world, so you aren’t constantly forced to stay long in these high-tension areas. It helps keep the gameplay novel and interesting, without putting too much emphasis on having to play stealthy.
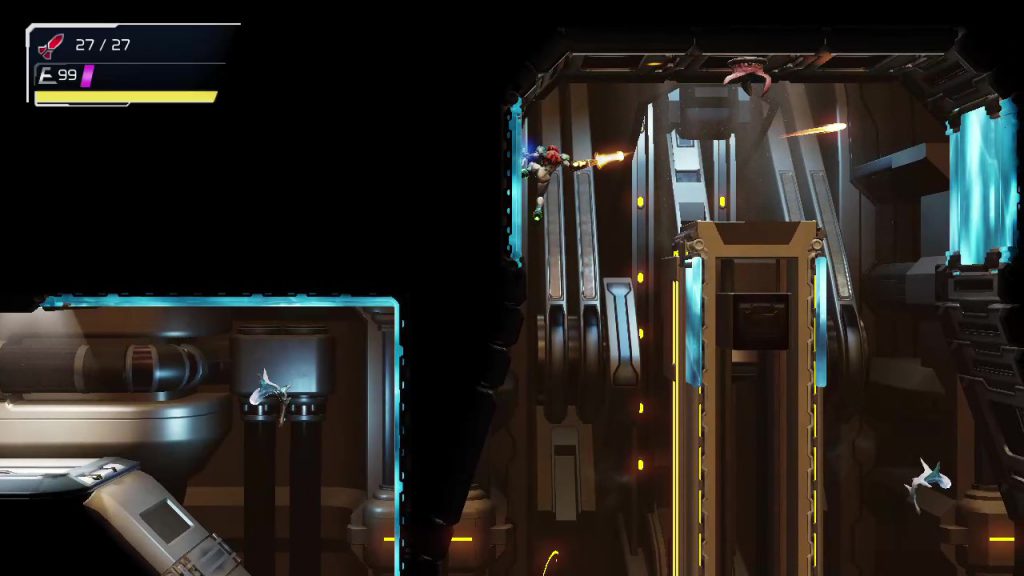
How about the level design within each EMMI zone? By and large, there are two kinds of map design within EMMI zones: large, open spaces where you get plenty of space to move around, and small, narrow corridors that require specific strategies to traverse through safely. While there are rooms within the EMMI zones which are one or the other of those types, often you’ll encounter rooms which mix both types of design together, providing variety in how you plan and execute your evasion. There are also some special areas to help or hinder your approach, including spider magnet walls and ceilings to cling to, pressure plate doors requiring fast maneuvering to blast through, and waterlogged floors that inhibit your movement.
An important aspect of the level design is that it gives you ways to evade the EMMI. When an EMMI has detected your sound, it will pursue your sounds until it finds you or you get far enough away that it stops investigating. The level design supports many strategies for getting out of this pursuit. For instance, you can lead the EMMI off into an isolated part of the map, then double back down a different path to go around it to try and quickly reach your objective. Another way is to take advantage of your mobility to get to areas of the map the EMMI can’t immediately follow you to, forcing it to take another path to get there and increasing the time you have to get out of pursuit range entirely. You just have to look at the map and figure out how best to make your way through safely.
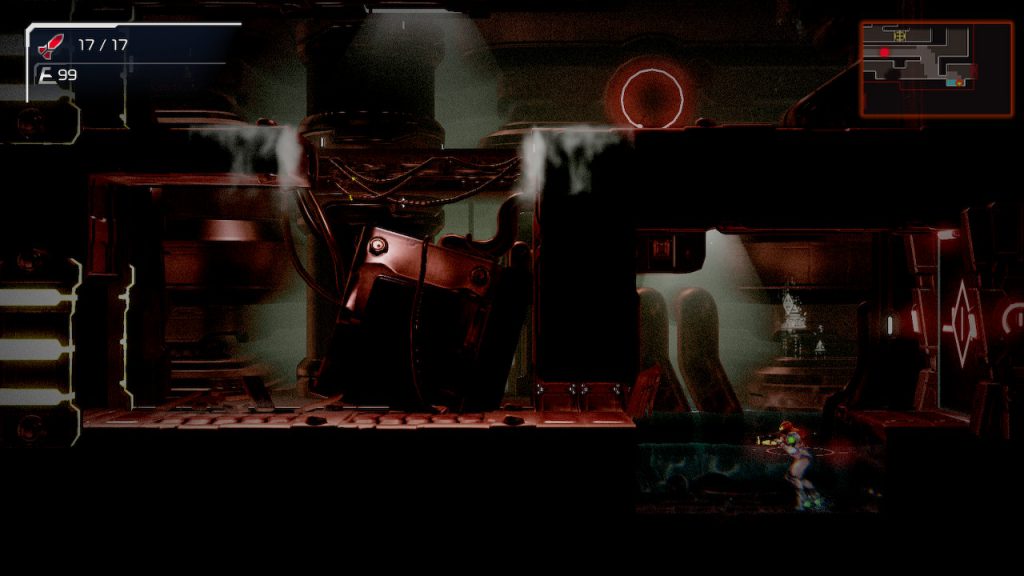
Finally, the visual look of the levels themselves contribute to how the player should feel inside an EMMI zone. While the EMMI is still alive and patrolling, the entire area is grainy and gray, and haunting tones play in the background. Once the EMMI is defeated, the entire area brightens up, the grainy filter is gone, and you hear no more spooky music. Additionally, the world map changes the EMMI zone area to have green backgrounds, indicating you’ve cleared that zone.
Evasion
You can’t hurt the EMMI without the Omega Cannon, and the level design forces you to move in and out of EMMI zones several times before you gain access to the room housing the energy which powers that cannon. That leaves you with two options for dealing with the EMMI while on their turf: running and hiding.
Running is the most obvious solution, and there are various ways the game encourages you to do so and not move too slowly. Your Aeion energy, the ability which powers your Phantom Cloak (and certain other moves) recharges more quickly when you move, so you have to move around at some point to regain your ability to hide. A lot of the map design encourages hiding in a safe spot to plot your next move, then darting over to the next safe spot to repeat the process all over again. The more quickly and carelessly you move, however, the more “noise” Samus makes, increasing the odds that the EMMI will hear you and come to investigate your position. You can risk running for an exit, but if you’re spotted, the EMMI zone exits close until you break the pursuit.
The Phantom Cloak, once you’ve acquired it, allows you to find a spot safe from EMMI wandering and hide from visual detection. While active, it drains your Aeion energy resource, but standing still makes the resource drain significantly less than if you are moving while cloaked. This, along with Aeion energy recharging faster when you move (if you aren’t using an Aeion ability) encourages you to plan your next moves while cloaked, uncloak to execute that plan, then activate the cloak again in your next safe spot to make the next step of your plan. Of course, things don’t always work the way you planned them, and a quick activation of the Phantom Cloak gives you a quick way out of being spotted, hopefully allowing you time to get away from the EMMI threat.
Another aspect of Phantom Cloak is that the game allows it to drain life energy if you run out of Aeion energy while cloaked, and this functions as a risky way to prolong your hidden state. It makes for an interesting player decision: do you continue using the Phantom Cloak and risk losing too much life to deal with enemies beyond the EMMI zone, or do you uncloak and risk the threat of EMMI detection? It presents yet another interesting facet to EMMI zone gameplay.
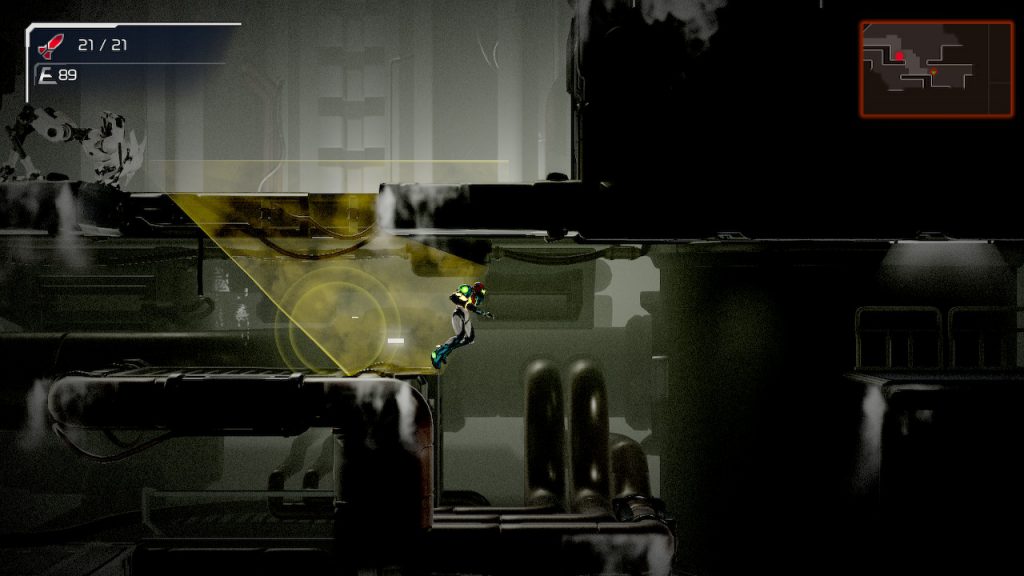
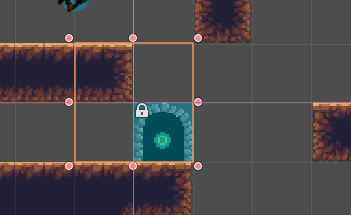
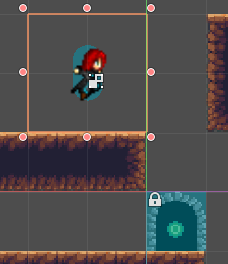
All the decisions you need to make while in the EMMI zone are aided by the information the game chooses to give you while in the zone. If the EMMI is outside of the screen, but close to you to be within the minimap, a red dot appears on the minimap to indicate its whereabouts. Once an EMMI gets close enough to detect the noises you make, a big yellow circle appears on screen to illuminate the precise area within which it can hear you, and while in this area your sound-making movements are highlighted by smaller yellow circles, letting you know exactly what you’re doing to attract the EMMI’s attention. A blue cone is projected from the EMMI’s face, representing the area in which the EMMI can see you, allowing you to react to its sight and do your best to stay out of it. Finally, if it sees you, the cone turns red during the short moment of time the EMMI spends transitioning to pursuit mode, giving you an opportunity to get a head start on your escape.
Engaging the EMMI
Much of the time you spend in an EMMI zone revolves around avoiding EMMI interaction, because to do so risks death. You can’t run from them forever, though. Let’s take a look at the two ways you can directly interact with the EMMI: attacking it with the Omega Cannon, and attempting to escape its grasp when you are caught.
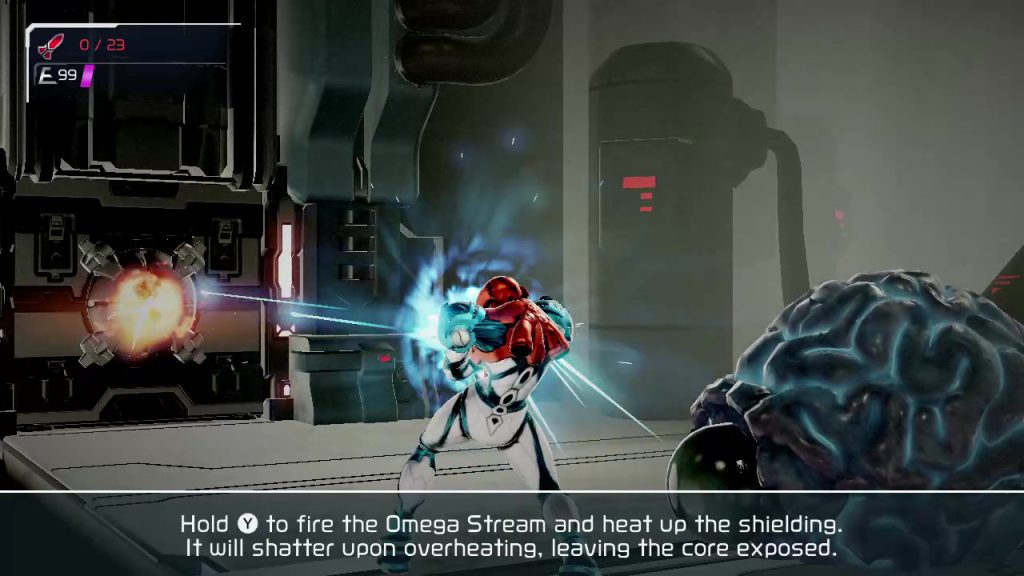
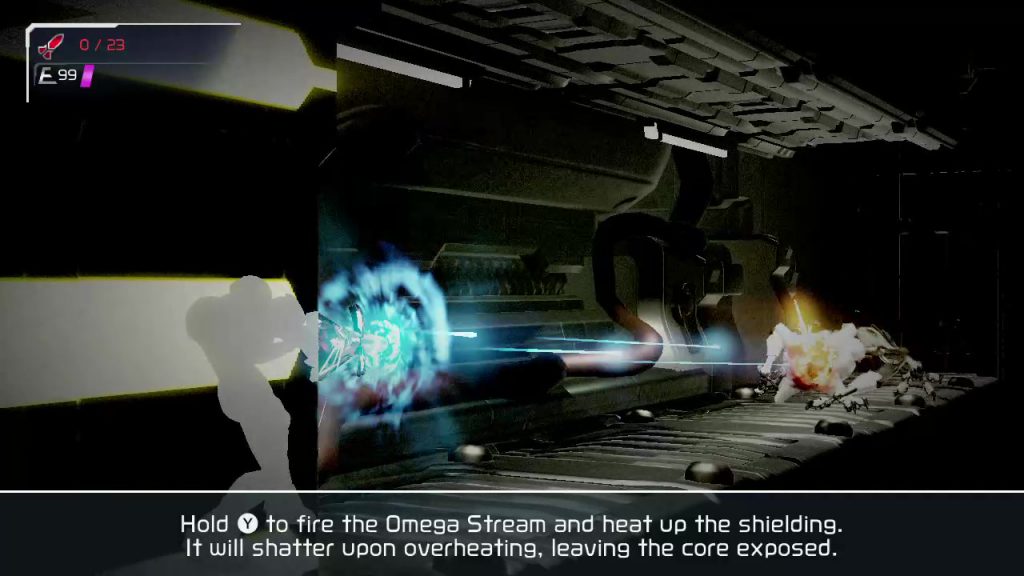
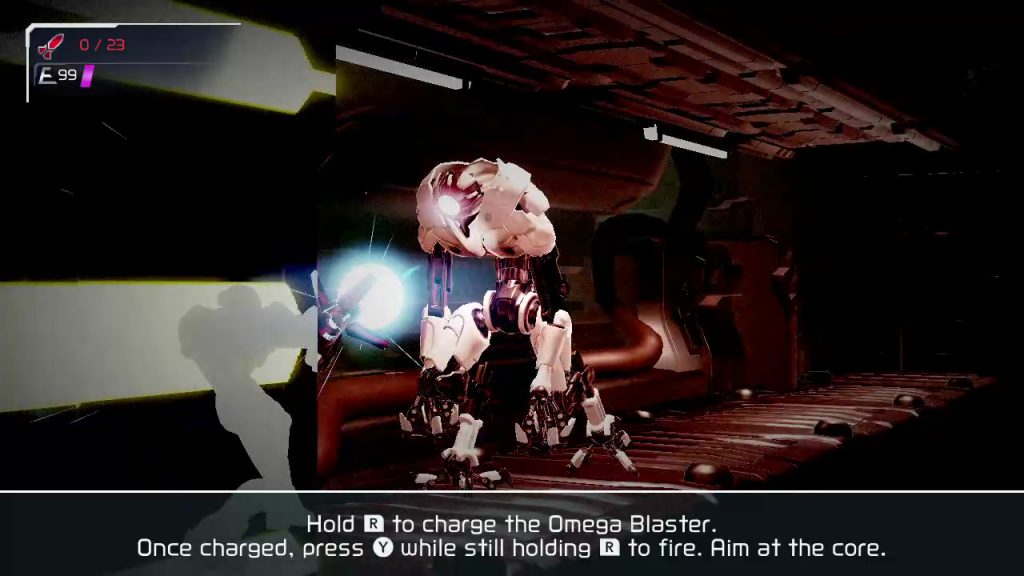
The Omega Cannon has two forms: one gives you a rapid-fire stream of energy bullets, or the Omega Stream, the other a blast with a charging period, or the Omega Blaster. You need both abilities (after the tutorial zone) to defeat an EMMI: Omega Stream is required to take down the shielding on the EMMI’s head, and Omega Blast is needed to take out the core once the shielding is down.
It takes a lot of rapid-fire shots to take the shielding down, so you’ll need to maneuver through the environment to find long stretches of corridor to give you enough time to land enough shots to take down the shield. Oftentimes, the corridor you’re in isn’t quite long enough to completely destroy the shield, so you have to judge when to disengage and move away to avoid getting caught, and subsequently where you’ll move to next to renew the assault. The shield also regenerates if you haven’t taken it down and you stop damaging it, so it’s not as simple as firing a few shots, moving away, and firing a few more shots; you inherently have to take some risky positioning to make sure you do enough damage in one encounter to not allow the shielding to fully recharge by the next time you position yourself to strike.
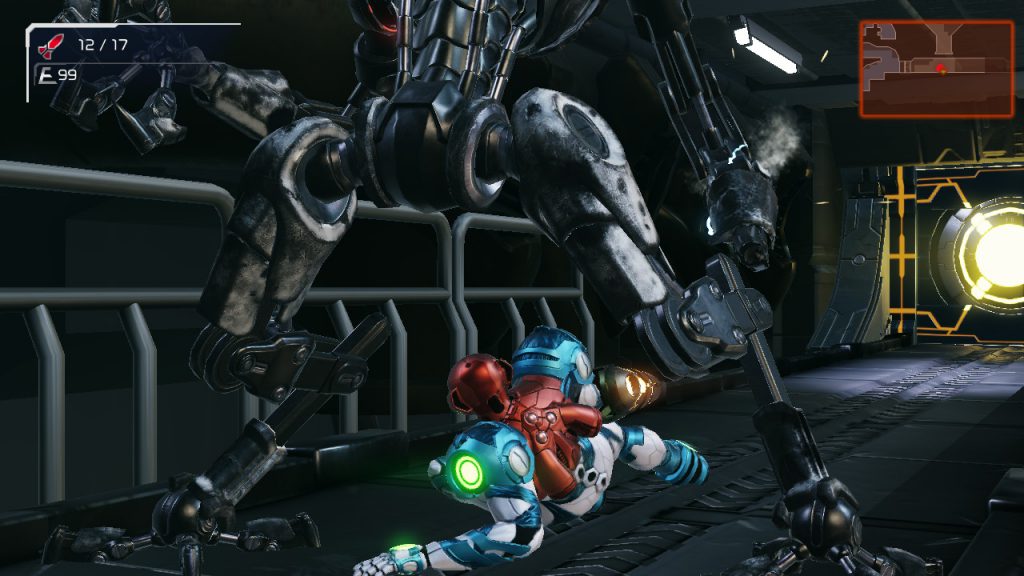
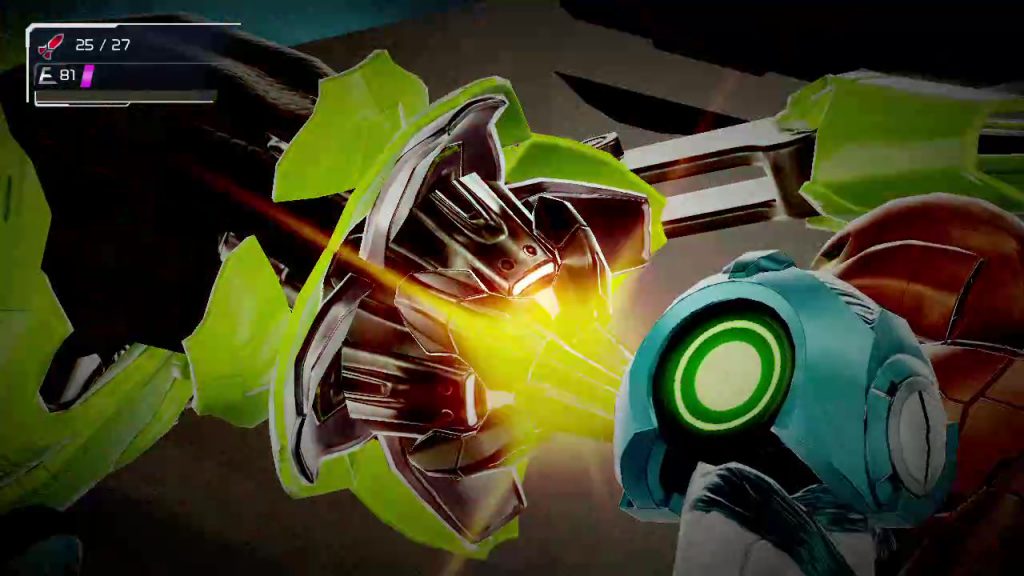
Once the shield is taken down, the EMMI is stunned for a brief period of time. If you’re not too close, you can start charging your Omega Blaster during this period. Otherwise, you once again need to move far enough away that you give yourself enough time to charge up the blast and aim for the head. This can lead to some tense, thrilling moments where you hold your ground and manage to get your shot off just before the EMMI catches you.
(Yeah. That was close.)
Something you’ll need to adapt to is the varying speeds EMMI will use when approaching you. Sometimes, they’ll come at you slowly, giving you plenty of time to damage them; other times, they’ll come at you rapidly, and you may find yourself needing to risk your position to get a few more hits in before you move away. The more you engage with an EMMI, the more of a feel you’ll get for the speeds it’ll employ and when it’ll employ them, giving you more information to use in planning your attack.
What if you are caught? When the game launches you into an EMMI capture sequence, you are given two chances to counter the EMMI’s capture strike: once when it grabs at you, and once more when it goes for the killing blow. In both cases, the timing of when the move happens is randomized, so you essentially have to guess when it’s going to come and hope you guessed correctly. You are told that it is almost impossible to counter these blows, which makes it all the more thrilling when you do succeed in landing the parry and are able to escape the EMMI’s clutches. Most of the time, the counter will fail, but by giving you a slim chance of escape, despite failing most of the time you will still feel as though you had some measure of control over your fate.
As someone who specifically dislikes gameplay where failing at stealth immediately results in total failure, I really appreciated this approach to giving you a chance to get out of trouble, even though most of the time I failed to do so.
Even when the EMMI lands the killing blow and you have to reload, the game spawns you just outside of whichever EMMI zone entrance you came through, instead of forcing you to start from wherever you last saved. This allows you to immediately go back in and try again without having to fight your way back; alternatively, if you want to take a break from EMMI zone gameplay, you can wander off and do something else for awhile before diving back in. This is a great approach to minimize player frustration with failure, by making the consequence of it less severe.
There is also something to be said to having an enemy that constant hunts for you, that you can do nothing about but to evade. The feeling you get when your efforts finally lead to you gaining the power to destroy that hunter once and for all is exhilarating, leaving you fired up and raring to take on the next EMMI.
As shown, there are many different mechanics that come together to make up the EMMI zone experience. From the level design, to the various ways you are given to evade the EMMI, to how you engage the EMMI directly, these mechanics come together to provide plenty of experiences for you within an EMMI zone.
Conclusion
Metroid Dread is an awesome game, in my opinion, and a large contributor to that great gameplay are the EMMI zones. You are taught how handle EMMI zones through a combination of guided experiences, cutscenes, and gameplay. Afterwards, the various game mechanics specific to EMMI zones come together to form a tense, challenging experience that straddles the line between being fun and frustrating.
I think the game would be more boring without EMMI zones, and that is a testament to how effectively they are designed. If ever I want to implement action-based stealth mechanics into my own games, I’ll be taking cues from Metroid Dread’s EMMI zones as an example of how to do it right.
Welcome to Part 2 of my tutorial for creating a debugging interface in Godot! In Part 1, we created the base for our debugging system. If you haven’t read that part, you should do so now, because the rest of the tutorial series will be building atop it. Alternatively, if you just want the code from the end of Part 1, you can check out the tutorial-part-1 branch in the Github repo.
At this point, we have the base of a debugging system, but that’s all it is: a base. We need to add things to it that will render the debugging information we want to show, as well as an API to DebugLayer that is responsible for communicating this information.
We’ll do this through “debug widgets”. What’s a debug widget? It’s a self-contained node that accepts a set of data, then displays it in a way specific to that individual widget. We’ll make a base DebugWidget node, to provide common functionalities, then make other debug widgets extend that base that implement their custom functionalities on top of the base node.
Alright, enough high-level architecture talk. Let’s dive in and make these changes!
Creating the Base DebugWidget
To get started, we want a place to store our debug widgets. To that end, make a new directory in _debug, called widgets. In this new widgets directory, create a new script called DebugWidget.gd, extending MarginContainer.
# Base class for nodes that are meant to be used with the DebugLayer system.
class_name DebugWidget
extends MarginContainer
Note the custom class_name. This is important, because later on we’ll be using it to check whether a given node is a debug widget.
You may need to reload your Godot project to ensure that the custom class_name gets registered.
Next, we’re going to add something called “widget keywords”:
# Abstract method which must be overridden by the inheriting debug widget.
# Returns the list of widget keywords. Responses to multiple keywords should be provided in _callback.
func get_widget_keywords() -> Array:
  push_error("DebugWidget.get_widget_keywords(): No widget keywords have been defined. Did you override the base DebugWidget.get_widget_keywords() method?")
  return []
This function will be responsible for returning a debug widget’s widget keywords. What are widget keywords, though?
To give a brief explanation, widget keywords are the way we’re going to expose what functionalities this debug widget provides to the debugging system. When we want to send data to a widget, the debugging system will search through a list of stored widget keywords, and if it finds one matching the one we supply in the data-sending function, it will run a callback associated with that widget keyword.
If that doesn’t make much sense right now, don’t worry. As you implement the rest of the flow, it should become clearer what widget keywords do.
One thing to note about the code is that we’re requiring inheriting classes to override the method. This is essentially an implementation of the interface pattern (since GDScript doesn’t provide an official way to do interfaces).
Let’s add a couple more functions to DebugWidget.gd:
# Abstract method which must be overridden by the inheriting debug widget.
# Handles the widget's response when one of its keywords has been invoked.
func _callback(widget_keyword, data) -> void:
  push_error('DebugWidget._callback(): No callback has been defined. (' + widget_keyword + ', ' + data + ')')


# Called by DebugContainer when one of its widget keywords has been invoked.
func handle_callback(widget_keyword: String, data) -> void:
  _callback(widget_keyword, data)
handle_callback() is responsible for calling the _callback() function. Right now, that’s all it does. We’ll eventually also do some pre-callback validation in this function, but we won’t get into that just yet.
_callback() is another method that we explicitly want the inheriting class to extend. Essentially, this is what will be run whenever something uses one of the debug widget’s keywords. Nothing is happening there right now; all the action is going to be in the inheriting debug widgets.
That’s it for the base DebugWidget. Time to extend that base!
Creating the DebugTextList DebugWidget
Remember that DebugLabel that was discussed at the beginning of the article? Having a text label that you can update as needed is a useful thing for a debugging system to have. Why stop with a single label, though? Why not create a debug widget that is a list of labels, which you can update with multiple bits of data?
That’s the debug widget we’re going to create. I call it the DebugTextList.
I prefix debug widget nodes with Debug, to indicate that they are only meant to be used for debugging purposes. It also makes it easy to find them when searching for scenes to instance.
Create a directory in widgets called TextList, then create a DebugTextListscene (not script). If you’ve registered the DebugWidget class, you can extend the scene from that; otherwise, this is the point where you’ll need to reload the project in order to get access to that custom class.
Why create it as a scene, and not as another custom node? Really, it’s simply so that we can create the node tree for our debug widget using the editor’s graphical interface, making it simpler to understand. It’s possible to add the same child nodes through a script, and thereby make it possible to make the DebugTextList a custom node. For this tutorial, however, I’m going to keep using the scene-based way, for simplicity.
Alright, let’s get back on with the tutorial.
Add a VBoxContainer child node to the DebugTextList root node. Afterwards, attach a new script to the DebugTextList scene, naming it DebugTextList.gd, and have it extend DebugWidget. Replace the default script text with the following code:
listNode is a reference to the VBoxContainer. We also have defined a const, WIDGET_KEYWORDS, which will define the widget keywords this debug widget supports. Technically, you could just use the keyword’s strings where needed, rather than define a const, but using the const is easier, as you can see below.
# Handles the widget's response when one of its keywords has been invoked.
func _callback(widget_keyword: String, data) -> void:
  match widget_keyword:
    WIDGET_KEYWORDS.ADD_LABEL:
      add_label(data.name, str(data.value))
    WIDGET_KEYWORDS.REMOVE_LABEL:
      remove_label(data.name)
    _:
      push_error('DebugTextList._callback(): widget_keyword not found. (' + widget_keyword + '", "' + name + '", "' + str(WIDGET_KEYWORDS) + '")')


# Returns the list of widget keywords.
func get_widget_keywords() -> Array:
  return [
    WIDGET_KEYWORDS.ADD_LABEL,
    WIDGET_KEYWORDS.REMOVE_LABEL
  ]
Notice that we’re overriding both _callback() and get_widget_keywords(). The latter returns the two widget keywords we defined in the const, while the former performs a match check against the widget_keyword argument to see if it matches one of our two defined keywords, running a corresponding function if so. By using the const to define our widget keywords, we’ve made it easier to ensure that the same values get used in all the places needed in our code.
match is Godot’s version of implementing the switch/case pattern used in other languages (well, it’s slightly different, but most of the time you can treat it as such). You can read more about it here. The underscore in the match declaration represents the default case, or what happens if widget_keyword doesn’t match our widget keywords.
Let’s go ahead and add the two response functions now: add_label() and remove_label(). We’ll also add a helper function that is used by both, _find_child_by_name().
# Returns a child node named child_name, or null if no child by that name is found.
func _find_child_by_name(child_name: String) -> Node:
  for child in listNode.get_children():
    if 'name' in child and child.name == child_name:
      return child

  return null


# Adds a label to the list, or updates label text if label_name matches an existing label's name.
func add_label(label_name: String, text_content: String) -> void:
  var existingLabel = _find_child_by_name(label_name)
  if existingLabel:
    existingLabel.text = text_content
    return

  var labelNode = Label.new()
  labelNode.name = label_name
  labelNode.text = text_content
  listNode.add_child(labelNode)


func remove_label(label_name) -> void:
  var labelNode = _find_child_by_name(label_name)
  if labelNode:
    listNode.remove_child(labelNode)
_find_child_by_name() takes a given child_name, loops through the children of listNode to see if any share that name, and returns that child if so. Otherwise, it returns null.
add_label() uses that function to see if a label with that name already exists. If the label exists, then it is updated with text_content. If it doesn’t exist, then a new label is created, given the name label_name and text text_content, and added as a child of listNode.
remove_label() looks for an existing child label, and removes it if found.
With this code, we now have a brand-new debug widget to use for our debugging purposes. It’s not quite ready for use to use, yet. We’re going to have to make changes to DebugLayer in order to make use of these debug widgets.
Modifying DebugLayer
Back in Part 1 of this tutorial, we made the DebugLayer scene a global AutoLoad, to make it accessible from any part of our code. Now, we need to add an API to allow game code to send information through DebugLayer to the debug widgets it contains.
Let’s start by adding a dictionary for keywords that DebugLayer will be responsible for keeping track of.
# The list of widget keywords associated with the DebugLayer.
var _widget_keywords = {}
Next, we’ll add in the ability to “register” debug widgets to the DebugLayer.
func _ready():
  # ...existing code
  _register_debug_widgets(self)


# Go through all children of provided node and register any DebugWidgets found.
func _register_debug_widgets(node) -> void:
  for child in node.get_children():
    if child is DebugWidget:
      register_debug_widget(child)
    elif child.get_child_count() > 0:
      _register_debug_widgets(child)


# Register a single DebugWidget to the DebugLayer.
func register_debug_widget(widgetNode) -> void:
  for widget_keyword in widgetNode.get_widget_keywords():
    _add_widget_keyword(widget_keyword, widgetNode)
In our _ready() function, we’ll call _register_debug_widgets() on the DebugLayer root node. _register_debug_widgets() loops through the children of the passed-in node (which, during the ready function execution, is DebugLayer). If any children with the DebugWidget class are found, it’ll call register_debug_widget() to register it. Otherwise, if that child has children, then _register_debug_widgets() is called on that child, so that ultimately all the nodes in DebugLayer will be processed to ensure all debug widgets are found.
register_debug_widget(), meanwhile, is responsible for looping through the debug widget’s keywords (acquired from calling get_widget_keywords()) and adding them to the keywords dictionary via _add_widget_keyword(). Note that this function I chose to not mark as “private” (by leaving off the underscore prefix). There may be reason to allow external code to register a debug widget manually. Though I personally haven’t encountered this scenario yet, the possibility seems plausible enough that I decided to not indicate the function as private.
Let’s add the _add_widget_keyword() function now:
# Adds a widget keyword to the registry.
func _add_widget_keyword(widget_keyword: String, widget_node: Node) -> void:
  var widget_node_name = widget_node.name if 'name' in widget_node else str(widget_node)

  if not _widget_keywords.has(widget_node_name):
    _widget_keywords[widget_node_name] = {}

  if not _widget_keywords[widget_node_name].has(widget_keyword):
    _widget_keywords[widget_node_name][widget_keyword] = widget_node
  else:
    var widget = _widget_keywords[widget_node_name][widget_keyword]
    var widget_name = widget.name if 'name' in widget else str(widget)
    push_error('DebugLayer._add_widget_keyword(): Widget keyword "' + widget_node_name + '.' + widget_keyword + '" already exists (' + widget_name + ')')
    return
That looks like a lot of code, but if you examine it closely, you’ll see that most of that code is just validating that the widget data we’re working with was set up correctly. First, we get the name of widget_node (aka the name as entered in the Godot editor). If that node’s name isn’t already a key in our _widget_keywords dictionary, we add it. Next, we check to see if the widget_keyword already exists in the dictionary. If it doesn’t, then we add it, setting the value equal to the widget node. If it does exist, we push an error to Godot’s error console (after some string construction to make a developer-friendly message).
Interacting with Debug Widgets
At this point, we can register debug widgets so that our debugging system is aware of them, but we still don’t have a means of communicating with the debug widgets. Let’s take care of that now.
# Sends data to the widget with widget_name, triggering the callback for widget_keyword.
func update_widget(widget_path: String, data) -> void:
  var split_widget_path = widget_path.split('.')
  if split_widget_path.size() == 1 or split_widget_path.size() > 2:
    push_error('DebugContainer.update_widget(): widget_path formatted incorrectly. ("' + widget_path + '")')

  var widget_name = split_widget_path[0]
  var widget_keyword = split_widget_path[1]

  if _widget_keywords.has(widget_name) and _widget_keywords[widget_name].has(widget_keyword):
    _widget_keywords[widget_name][widget_keyword].handle_callback(widget_keyword, data)
  else:
    push_error('DebugContainer.update_widget(): Widget name and keyword "' + widget_name + '.' + widget_keyword  + '" not found (' + str(_widget_keywords) + ')')
Our API to interact with debug widgets will work like this: we’ll pass in a widget_path string to update_widget(), split with a . delimiter. The first half of the widget_path string is the name of the widget we want to send data to; the second half is the widget keyword we want to invoke (and thereby tell the widget what code to run).
update_widget() performs string magic on our widget_path, makes sure that we sent in a properly-formatted string and that the widget and widget keyword is part of _widget_keywords. If things were sent correctly, the widget node reference we stored during registration is accessed, and the handle_callback() method called, passing in whatever data the widget node expects. If something’s not done correctly, we alert the developer with error messages and return without invoking anything.
That’s all we need to talk to debug widgets. Let’s make a test to verify that everything works!
Currently, our TestScene scene doesn’t have an attached script. Go ahead and attach one now (calling it TestScene.gd) and add the following code to it:
This is just a simple counter functionality, where test_ct is incremented by 1 each process step. Between 0-899, Debug.update_widget() will be called, targeting a debug widget named “TextList1” and the add_widget widget keyword. For the data we’re passing the widget, we send the name of the label we want to update, and the value to update to (which is a string version of test_ct). Once test_ct hits 900, however, we want to remove the label from the debug widget, which we accomplish through another Debug.update_widget() call to TextList1, but this time using the remove_label widget keyword. Finally, once test_ct hits 1000, we reset it to 0 so it can begin counting up anew.
If you run the test scene right now, though, nothing happens. Why? We haven’t added TextList1 yet! To do that, go to the DebugLayer scene, remove the existing test label (that we created during Part 1), and instance a DebugTextList child, naming it TextList1. Now, if you run the test scene and open up the debugging interface (with Shift + `, which we set up in the previous part), you should be able to see our debug widget, faithfully reporting the value of test_ct each process step.
If that’s what you see, congratulations! If not, review the tutorial code samples and try to figure out what might’ve been missed.
One More Thing
There’s an issue that we’re not going to run into as part of this tutorial series, but that I’ve encountered during my own personal use of this debugging system. To save future pain and misery, we’re going to take care of that now.
Currently, our code for debug widgets always assumes that we’re going to pass in some form of data for it to process. But what if we want a debug widget that doesn’t need additional data? As things stand, because debug widgets assume that there will be data, the code will crash if you don’t pass in any data.
To fix that, we’ll need to add a couple of things to the base DebugWidget class:
# Controls if the widget should allow invocation without data.
export(bool) var allow_null_data = false


# Called by DebugContainer when one of its widget keywords has been invoked.
func handle_callback(widget_keyword: String, data = null) -> void:
  if data == null and not allow_null_data:
    push_error('DebugWidget.handle_callback(): data is null. (' + widget_keyword + ')')
    return

  _callback(widget_keyword, data)
We’ve added an exported property, allow_null_data, defaulting it to false. If a debug widget implementation wants to allow null data, it needs to set this value to true.
handle_callback() has also been modified. Before it runs _callback(), it first checks to see if data is null (which it will be if the second argument isn’t provided, because we changed the argument to default to null). If data is null, and we didn’t allow that, we push an error and return without running callback(). That prevents the game code crashing because of null data, and it also provides helpful information to the developer. If there is data, or the debug widget explicitly wants to allow null data, then we run _callback(), as normal.
That should take care of the null data issue. At this point, we’re golden!
Congratulations!
Our debugging system now supports adding debug widgets, and through extending the base DebugWidget class we can create whatever data displays we want. DebugTextList was the first one we added, and hopefully it should be easy to see how simple it is to add other debug widgets that show our debugging information in whatever ways we want. If we want to show more than one debug widget, no problem, just instance another debug widget!
Even though all this is pretty good, there are some flaws that might not be immediately apparent. For instance, what happens if we want to implement debug widgets that we don’t want to be shown at the same time, such as information about different entities in our game? Or what if we want to keep track of so much debugging information that we clutter the screen, making it that much harder to process what’s going on?
Wouldn’t it be nice if we could have multiple debug scenes that we could switch between at will when the debug interface is active? Maybe we’d call these scenes “containers”. Or, even better, a DebugContainer.
That’s what we’ll be building in the next part of this tutorial!
If you want to see the complete results from this part of the tutorial, check the tutorial-part-2 branch of the Github repo.
At some point during the development of a game, you need to be able to show information that helps you debug issues in your game. What kind of information? That really depends on your game and what your needs are. It could be as simple as printing some text that shows the result of an internal calculation, or it could be as fancy as a chart showing the ratio of decisions being made by the game’s artificial intelligence.
There are different kinds of debugging needed as well. Sometimes, you need something temporary to help you figure out why that function you just wrote isn’t behaving the way you expect it to. Other times, you want an “official” debugging instrument that lives on as a permanent display in your game’s debugging interface.
How does one go about building a debugging system, however? In this blog tutorial, we’ll build a debugging system in the Godot game engine, one that is flexible, yet powerful. It’s useful both for temporary debugging and a long-term debugging solution. I use this system to provide a debugging interface for my own games, and I want to share how to make one like it in the hopes that it helps you in your own game development efforts.
This will be a multiple-part series. At the end of it, you’ll have the root implementation of the debugging system, and knowledge on how to extend it to suit your debugging purposes.
Godot comes with a number of functionalities that are useful for debugging. The most obvious of these is the trusty print() function. Feed it a string, and that string will get printed out to the debugging console during game runtime. Even when you have a debugging system in place, print() is still useful as part of your toolset for temporary debugging solutions. That said, nothing you show with print() is exposed to an in-game interface, so it’s not very useful if you want to show debugging information on a more permanent basis. Also, if you need to see information that updates on every frame step, the debugging console will quickly be overwhelmed with a flood of printed messages, to the point where Godot will bark at you about printing too many messages. Thus, while print() definitely has its uses, we are still in need of something more robust for long-term debugging solutions.
One way I solved this problem in the past is by creating a DebugLabel node, based on a simple Label. This node would listen for a signal, and when said signal was received it would set its text value to whatever string was sent to it. The code looked something like this:
This solution also depended on a separate GlobalMessenger system that functions as a global way of passing information. But that system is a tale for another day.
This gave me a solution for printing debugging information that updated on every process step, without overloading the debugging console. While this little component was useful, it had its drawbacks. Every call to print a message to the DebugLabel would overwrite the previous value, so if I needed to show more than one piece of updating information, I would have to create multiple DebugLabel nodes. It wouldn’t take long for my scenes to be cluttered with DebugLabel nodes. Also, this still wasn’t part of a debugging system. If there was a DebugLabel, it’d show, regardless of whether you needed to view debugging information or not. Thus, while this node also served a valuable purpose, it was not enough for a proper debugging solution.
So what does a debugging solution need? It needs a way to conditionally show and hide debugging information, depending on whether such information needs to be viewed. It also needs to expose a method for game code to interact with it to pass in debugging information. There are many possible kinds of information that we’d want to see, so this interaction method must support being able to accept multiple kinds of information. Finally, there should be an easy way of creating debugging scenes to organize the information in whatever ways make sense to those that view the debugging information.
With that high-level information, let’s start by tackling the first part of that paragraph: conditionally showing and hiding the debugging information.
Creating a Test Scene
But before we start working on the debugging system proper, we should have a test scene that exists to help us test that what we’re creating actually works. It doesn’t need to be anything fancy.
While this part of the tutorial is optional, the tutorial series will be assuming the existence of this test scene. If you choose not to make it, then you’ll have to figure out how to test the debugging system’s code in a different way.
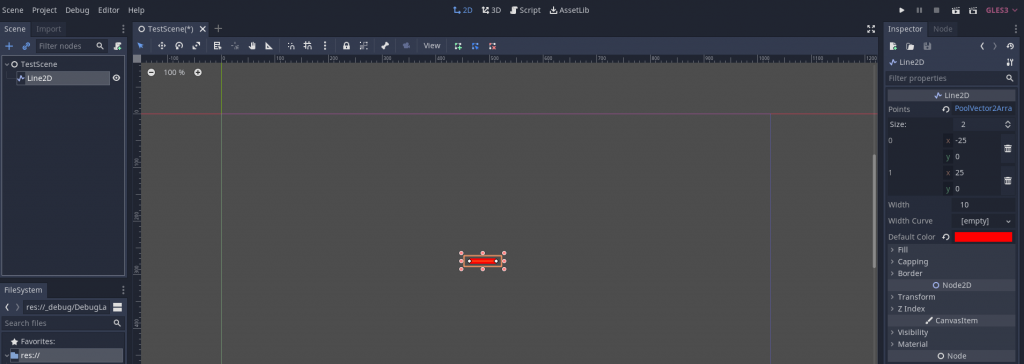
Create a scene, and have it extend Node. Let’s call it “TestScene”. In TestScene, add a Line2D node, make it whatever color you want (I chose red), and set the points to make it some easily-visible size (I set mine to [-25, 0], [25, 0] to make a 50px-long horizontal line). Move the Line2D somewhere near the center of the scene; it doesn’t have to be exact, as long as it isn’t too close to the top or edge of the game window. Finally, click the triangle button to run Godot’s main scene; since we don’t have one defined, Godot will pop up an interface that will allow you to make TestScene the default scene, which you should do.
You can alternatively just run this individual scene without making it the main scene; I have chosen to make it the main scene in this tutorial purely out of convenience.
This is what my version of the test scene looks like after doing these things:
Now that we have a test scene, let’s get to building the debugging system proper.
Creating the DebugLayer Global
We need a way to interact with the debugging interface from anywhere in our game code. The most effective way to do this is to create a global scene that it loaded as part of the AutoLoads. This way, any time our game or a scene in our game is run, the debugging system will always be available.
Start by creating a new scene, called DebugLayer, and have it extend the CanvasLayer node. Once the scene is created, go to the CanvasLayer node properties and set the layer property to 128.
That layer property tells Godot what order it should render CanvasLayer nodes in. The highest value allowed for that property is 128, and since we want debugging information to be rendered atop all other information, that’s what we’ll set our DebugLayer to.
Now, create a script for our node, DebugLayer.gd. For now, we’re not going to add anything to it, we just want the script to be created. Make sure it, as well as the DebugLayer scene, are saved to the directory _debug (which doesn’t exist yet, so you’ll need to create it).
Finally, go to Project -> Project Settings -> AutoLoad, and add the DebugLayerscene (not the DebugLayer.gd script) as an AutoLoad, shortening its name to Debug in the process. This is how we’ll make our debugging interface accessible from all parts of our game.
Yes, you can add scenes to AutoLoad, not just scripts. I actually discovered that thanks to a GDQuest tutorial on their Quest system, and have since used that pattern for a wide variety of purposes, including my debugging system.
To verify that our DebugLayer shows in our game, add a Label child to the DebugLayer scene, then run the game. You should be able to see that Label when you run the game, proving that DebugLayer is being rendered over our TestScene.
Toggle Debug Visibility
This isn’t particularly useful yet, though. We want to control when we show the debugging information. A good way to do this is to designate a key (or combination of keys) that, when pressed, toggles the visibility of DebugLayer and any nodes it contains.
Open up the project settings again, and go to Input Map. In the textbox beside Action:, type “toggle_debug_interface” and press the Add button. Scrolling down to the bottom of the Input Map list will reveal our newly-added action at the bottom.
Now we need to assign some kind of input that will dispatch this toggle_debug_interface action. Clicking the + button will allow you to do this. For this tutorial, I’ve chosen to use Shift + ` as the combination of keys to press (Godot will show ` as QuoteLeft). Once this is done, go ahead and close the project settings window.
It’s time to start adding some code. Let’s go to DebugLayer.gd and add this code:
Right away, the editor will show an error on the visible = boolean line. You can confirm the error is valid by running the project and seeing the game crash on that line, with the error The identifier "visible" isn't declared in the current scope. That’s because CanvasLayer doesn’t inherit from the CanvasItem node, so it doesn’t contain a visible property. Therefore, we’ll need to add a node based on Control that acts as a UI container, and it is this node that we’ll toggle visibility for.
CanvasItem is the node all 2D and Control (aka UI) nodes inherit from.
Add a MarginContainer node to DebugLayer, calling it DebugUIContainer. Then, move the test label we created earlier to be a child of the DebugUIContainer. Finally, in DebugLayer.gd, change the visibility target to our new UI container:
onready var _uiContainer = $DebugUIContainer


func _set_ui_container_visibility(boolean):
  _uiContainer.visible = boolean
You may notice that I’m prefixing _uiContainer with an underscore. This is a generally-accepted Godot best practice for identifying class members that are intended to be private, and thus should not be accessed by code outside of that class. I also use camelCase to indicate that this particular variable represents a node. Both are my personal preferences, based on other best practices I’ve observed, and you do not need to adhere to this style of nomenclature for the code to work.
At this point, if you run the test scene, the test label that we’ve added should no longer be visible (because we’ve defaulted visibility to false). That’s only half the battle, of course; we still need to add the actual visibility toggling functionality. Let’s do so now:
func _input(_event):
  if Input.is_action_just_pressed('toggle_debug_interface'):
    show_debug_interface = !show_debug_interface
    _set_ui_container_visibility(show_debug_interface)
_input() is a function Godot runs whenever it detects an input action being dispatched. We’re using it to check if the input action is our toggle_debug_interface action (run in response to our debug key combination we defined earlier). If it is our toggle_debug_interface action, then we invert the value of show_debug_interface and call _set_ui_container_visibility with the new value.
Technically, we could just call the visibility function with the inverted value, but setting a variable exposes to outside code when the debug interface is being shown. While this tutorial is not going to show external code making use of that, it seems a useful enough functionality that we’re going to include it nonetheless.
Run the test scene again, and press Shift + `. This should now reveal our test label within DebugLayer, and prove that we can toggle the debug interface’s visibility. If that’s what happens, congratulations! If not, review the tutorial to try and identify what your implementation did incorrectly.
Congratulations!
We now have the basics of a debugging interface. Namely, we have a DebugLayer scene that will house our debugging information, one that we can make visible or invisible at the press of a couple of keys.
That said, we still don’t have a way of actually adding debugging information. As outlined earlier, we want to be able to implement debugging displays that we can easily reuse, with a simple API for our game code to send debugging information to the debugging system.
To accomplish these objectives, we’ll create something that I call “debug widgets”. How does a debug widget work? Find out in the next part of this tutorial!
You can review the end state of Part 1 in the Github repo by checking out the tutorial-part-1 branch.
Controls:
AWSD = Move/Jump
Right Mouse = Throw Hammer
Right Mouse (while hammer in air) = Teleport to Hammer's location
Left Mouse (while hammer in air) = Create platform
Left Click (on platform) = Select platform
Left Click (anywhere but a platform) = Deselect selected platform
q (while platform selected) = Delete platform
q (no platform selected) = Delete all platforms
If you need a goal, you can try to collect all the tomes. The main point of this prototype, however, is to play around with the movement mechanics.
2019 has been a good year for me, personally, and for my family. I’m blessed to have a new job, a new home, and plenty of learning experiences under my belt. If there’s any constant I can identify that sums up my overall take, it is this:
If you fight hard, you’ll put yourself in position to take advantage of good fortune, and find it easier to overcome struggles.
I want to trace back through the events of the year and offer my thoughts and commentary on them. My hope is that you, dear reader, may find some nuggets of truthful wisdom from these words of mine to help you in your own journeys, whatever they may be.
2019: Continuing the Game Development Journey
The start of last year found me working as a full-stack PHP/JavaScript developer for a small company in Rochester, Minnesota. Coming off my first-ever game jam, Ludum Dare 43, I started planning for the next game jam I intended to participate in, Ludum Dare 44. Part of that preparation would include learning Godot, an open-source game engine. I had built my own game engine, in JavaScript, as part of my game-dev self-education in 2018, in order to get an understanding of how game engines work, and having acquired that knowledge, I now wanted to focus my time more on games-making over engine-craft. I chose Godot due to its being open-source, as well as having first-class Linux support (so I could develop games on my Ubuntu laptop).
I also started vlogging my game development progress on Instagram, under the handle AspiringGameDev. It’s linked in my social media sidebar, if you should want to check it out.
By the time April arrived, and with it the start of the next Ludum Dare, I felt I had learned enough knowledge to be at least adequate in making a Godot game. With my wife handling the artwork, we dove headlong into Ludum Dare 44. Frankly, I was less pleased with the end result, “Impact!”, than I had been with the Ludum Dare 43 entry, “Sanity Wars”. The tight three-day deadline for Ludum Dare resulted in us being forced to cut out a lot of content we had planned to put in, and the resulting gameplay felt lackluster and boring. Impact! was judged accordingly, finishing with a worse score than Sanity Wars.
No matter, though. It was a learning experience all the same, and at this stage of my game development career all experience is good experience.
For the next few months, I started to work on small game experiments, practicing my craft. The first of these was an attempt to implement a mechanic I’ve always wanted to work with: free-form wall climbing, akin to that of a gecko. I spent about a month’s worth of time (minus work and family time) trying to make this work the way I’d envisioned. Alas, though I was able to get the wall-climbing aspect of the mechanic working, I found myself struggling to implement a smooth, intuitive way for the test character to climb from wall to ceiling. In the end, I chose to put the project aside, for now, in favor of working on a new experiment.
The next project I tackled was creating a top-down orientation game. Up to this point, most of what I’ve developed game-wise used a side-scrolling perspective, as this was what I was most familiar with. I wanted the experience of making a top-down game, as this would allow me to eventually make RPG-like games with exploration, narrative, and questing. I had just finished implementing some map mechanics, and was getting ready to work on dialogue systems, when something happened that would instigate a major force of change in my life.
On July 1st, 2019, I was laid off from my job.
2019: The Quest for Gainful Employment
Obviously, the layoff caught me by surprise, and my focus immediately shifted from game development to finding new employment. As part of that process, I needed a portfolio project to work on that could adequately showcase my programming proficiency. The JavaScript framework React has enjoyed considerable popularity the past few years, and though I did have a few small sample projects from my learning of how React worked, I believed I needed to create a more complex project with React if I wanted companies to take my React skills seriously (I had worked with vanilla JavaScript and Vue in previous jobs, so I had no professional React experience).
At the same time as I was considering this path, I heard of a site called Koji, a platform for users to create JavaScript game templates for other people to customize and publish, and they were looking to hire programmers to create templates for others to build upon. The idea came to me: what if I made a Koji game template in React? It’d be killing two birds with one stone: I’d get experience making a complex React project, and I’d be making a game I could potentially showcase to Koji. I had the perfect game in mind to make, too: Hangman. In the back of my mind, I’d always wanted to attempt making a Hangman game someday, but had not yet had the chance to act upon it.
It was settled: my portfolio project would be React Hangman. In between job applications and company interviews, I’d work on this portfolio project. Frankly, it was harder than I expected. Not the game mechanics themselves; I implemented the basic Hangman mechanics over the course of a weekend. The difficulty lay in adding all the other features necessary to make this feel like a smooth, polished game: save state, user menus, animation, artwork for the gallows, responsiveness at multiple screen sizes, bug-squashing…
Near the end of July, I got the prototype for the game solidified enough that I felt comfortable showing it to potential employers and contracting partners at in-person interviews. As it happened, I had several on-site interviews the last week of July, and where those interviews involved React I showcased React Hangman as example of what I could do. One of these interviews was with Best Buy, up in the Twin Cities (for those outside of Minnesota, that is the Minneapolis/St. Paul metropolitan area). They liked what they saw, I presume, for at the end of the week they made a contract offer to me (through the contracting agency filling the position), which I gladly accepted.
2019: The Move and the Collateral
I was no longer jobless, but now a new challenge arose: I needed to move from Rochester to the Twin Cities as soon as possible. Cue another month and a half of searching for places to live in the Twin Cities (we settled on a townhome rental in Apple Valley) combined with packing and moving, all around three weeks of having to commute three hours (minus traffic) to Best Buy’s corporate headquarters. During that time, I was also preparing a talk with a friend of mine around a UI tool called Framer X, which we gave at a Rochester coworking space called Collider.
Finally, around the end of September, things started settling down and I could start figuring out what personal projects to tackle next. The next game jam I was planning to take part in, Github’s Gameoff Jam, was due to start on November 1st, and I had wanted some time to experiment more with Godot before it began. Instead, however, I chose to finish the React Hangman project, since I felt it was close to being done. Plus, I wanted the experience of actually finishing and releasing a project.
So I spent the next few weeks running through my list of bugs to fix and features to implement. Yes, the next few weeks. Remember when I said I felt close to being done? That small amount of polish and bug-fixing took weeks of off-work time to finish. It taught me a valuable lesson: polish is not cheap. It’s not something you can just throw on a game and call it good. You have to account for significant development time making a game look and feel good.
The effort paid off. I had multiple comments from people to the effect that this was the best hangman game they’d ever played. One person commented on how smooth the game felt. My two previous Ludum Dare games lacked this level of polish and “juice” (a game-dev term for stuff that makes games feel good), and it was evident, even for a simple game of hangman, how much a difference polish really makes.
Fun fact: the music I used for React Hangman was originally an old song of mine that I threw in as a placeholder; I’d intended to compose my own music for the final release. People liked the temp music so much, though, that I chose to keep it as the release song.
This entire time, I had neglected to really unpack all the stuff in my home office and organize it the way I wanted to, so after releasing React Hangman I dedicated another week solely to this purpose. I’m pleased with how the end result turned out.
Now, only days remained until the start of Github Gameoff jam. I wished there was more time to spend on game experiments, but the time had been spent how it needed to be. Plus, I felt the experience of finishing React Hangman would help me in developing whatever effort would come from the Gameoff jam.
2019: Github Gameoff Jam (Or, How I Spent My November)
November 1st rolled up, and the theme for the jam was revealed: “Leaps and Bounds”. From now, Rebecca and I had an entire month to develop a game. I thought that would be more than enough time to get the job done.
Narrator: It was not.
My thoughts turned to puzzling over the theme. With a name such as “leaps and bounds”, I thought platformer would be an obvious choice of genre. I had spent a lot of time making platformers, however, and I felt the need to come up with at least some kind of twist to keep things interesting. In the end, we settled on the idea of a side-scrolling real-time strategy game, tentatively titled “Rabbit Trails”, in which the player’s goal was to place various gizmos to help colonies (“groups”) of rabbits make it from one location to another. I also decided that I wanted to add some kind of story to the game, having wanted to do so in previous game jams and run out of time to implement. The overall flavor was that the player was working for a company that catches rabbits and sells them for research, and interacts with a couple of company employees during the course of a game mission.
With the plan in mind, I started work on implementing the game’s core mechanics. I had never attempted anything close to a real-time strategy game before, so there were numerous foundational systems I needed to build: unit selection (and deselection), unit building, unit placement with validation, mouse camera movement, dialogue system… Looking back, that was a ridiculous number of features that I needed to create, and mostly from scratch at that (I used Godot Open Dialogue as the base for my dialogue system).
Unsurprisingly, these things took me a long time to develop, and before I knew it we were at the last week of the competition, and while many of the core systems were almost in place, there were still plenty of game-breaking bugs that needed to be resolved. No game content had yet been written, no sound effects had been created (and, on top of that, I’d have to implement spatial sound so players couldn’t hear the sounds of units halfway across the map where the camera wasn’t even looking), no game music composed…the scope of remaining work was daunting. Our son went to stay with the grandparents for the whole week, but I still had to work around my day job (contracting with a retail company means working Thanksgiving week, after all).
There was nothing for it but to tackle the challenge head-on. Rebecca cranked out needed artwork, while I steadily plowed through my list of bugs and features needed to make an MVP (minimum viable product, the bare minimum necessary to play the game). The days passed by slowly and quickly at the same time, and as time ran slowly out I cut more and more things out of the list for that MVP, including sound effects and music. It wasn’t until the night of the second to last day that I finally had a working prototype with full gameplay implemented. I spent the remainder of my time creating a tutorial stage, along with as many additional stages as I could manage. That turned out to be just one.
When time came to submit our project, I uploaded builds for my game (Windows, Linux, and web) on itch.io. When I went to submit the project to the jam, however, I found that the form for submission was gone. I was minutes too late.
We’d missed the deadline. What’s more, when I tried to open one of my builds to test (I’d been in such a rush I uploaded the builds without testing them first) and discovered that every single one of them crashed on load. This didn’t happen in any of my development builds, only on the releases. Oddly enough, I didn’t feel crushed, as one might expect after seeing a month’s worth of effort end up for naught. Truth be told, I was emotionally and mentally exhausted; practically every moment of free time I’d had the entire month had been spent solely on developing Rabbit Trails, and I felt relieved that the pressure was finally gone.
2019: Rest, Relaxation, and Reflection
Ultimately I chose to spend the entire month of December resting and recuperating. From the start of July onward, I really had not had a moment to really recover from the strain I placed myself under, what with the job hunting, the move, and then multiple subsequent projects I needed to finish, culminating with the game jam. I’d spent those months denying myself relaxation in dedication to getting work done; I resolved to spend December doing the opposite, favoring rest over rigor.
A month later, I think I made the right choice. I spent time (a lot of it) playing Remedy’s Control, a brilliant game. I watched some movies, something I hadn’t had time for in months. I started reading again. Not just fiction, but also books on game development theory, to percolate my mentality and kick around theories and ideas. I came to a realization that I’ve spent so much time on learning the programming aspects of game development that I’ve neglected the art of actually, you know, creating games. It’s a malady I intend to remedy.
2020: The Future
So ends my tale of yesteryear. What are my plans? I intend to keep vlogging, but I want to figure out how to present game development material that isn’t solely related to programming or the progress of personal projects. It’s not just for the sake of content; I myself need to focus outside of the programming side of things and embrace all the aspects of making games.
Speaking of making games…after my experience with the last jam, I had an epiphany of sorts. I was treating game jams as kickstarters to get me to make and finish some kind of project. What was really happening, though, was that the enforced time limits resulted in me not really getting to practice the aspects of game development I really needed to learn — crafting good gameplay, implementing juice, storytelling, etc. — and, without exception, each game jam project resulted in spending most of my time implementing features and not actually building much atop those features. Therefore, I have resolved to not participate in more game jams, at least for the near future.
Don’t get me wrong; I’m still going to work on games. Instead of enforcing arbitrary time limits and grinding myself to the bone to release what I can, I plan to focus on making playable prototypes, soliciting feedback, and ultimately settling on one to fully develop to completion for release. That’s been my goal since the start of my game development career, to make and release a game. After two years of focusing on learning, it’s time to start doing. We’ll see how this approach pays off.
I still have my day job as a web developer, and I don’t see that changing anytime soon. I still have my family, and I’ll still do my best to manage the balancing act of developing side projects and being a good husband and father.
And, somehow, someway, I want to find a way to introduce more time consuming content, instead of creating it. If I don’t rejuvenate myself, how can I energize the people I want to experience my work? Of course, this is easier said than done; my ambition far exceeds the physical limits of calendar days, and developing a game is going to take plenty of time. I don’t yet know how I can squeeze more time without sacrificing sleep (an act I find myself less capable of doing as the years pass by). But I want to find a way to make it work.
2019 was a good year, and I’m grateful for all that God has blessed me with, in opportunity and well-being. Here’s to an even better 2020. I’ll keep fighting hard, so that I can be ready to take advantage of any opportunity which comes my way.
I also want to blog more, especially some of the Godot stuff I’ve learned from the efforts of the Github Gameoff Jam. The project may not have been finished, but it was by no means a wasted experience!
If you follow me on Instagram, you probably know that I have been working on a game template for Koji for the past few months. It started out as a portfolio project for me when I was looking for a job, and even after I got the job I decided I wanted to finish it and release it as a template for other Koji users to build their own apps on top of.
In Godot 3.0, when you create a scene or a node, a 64×64 selection square appears around it by default. You cannot change the size of this selection square, and resizing it changes the scale of the scene/node, rather than resizing it.
To get the portal placed on the ground, I have to monkey around with offsets in the instanced scene itself. Ugh.
It gets particularly annoying when you are trying to place said scene/node instead of a snap-grid, and the 64×64 area not only clashes visually with your grid, it makes it hard to determine where the position actually is! It’s been a source of frustration for me as I learn how to make games using Godot.
Sprite is 32×32, but selection square is larger, so I can’t place the start position on the ground. Grr.
The good news it that this seems to be one of the things getting changed for Godot 3.1. While looking to see if there are ways to work around this quirk of Godot, I came across this change being merged into Godot’s master branch: https://github.com/godotengine/godot/pull/17502
Nice!
Basically, it resizes the selection rectangle to fit the dimensions of a sized child, and in cases where there is no sized child it uses a crosshair centered on the actual spawning position of the entity. This looks like it’ll resolve my gripes with the selection square quite well.
Godot 3.1 is currently in beta, so hopefully this will be released soon! Because the release seems imminent, I’ll just keep putting up with the selection square until 3.1 officially comes out.