Over the last three days, PixelLunatic and I worked on a game for Game Maker’s Tool Kit Game Jam 2022. Our entry is Dice Tower, and you can play it here!
Keep in mind that this is a game jam game, so this is far from perfect (for example, there is no audio), but we think the end result would up being pretty fun to play! We might decide to develop this further in the future, though we haven’t officially committed to doing so yet.
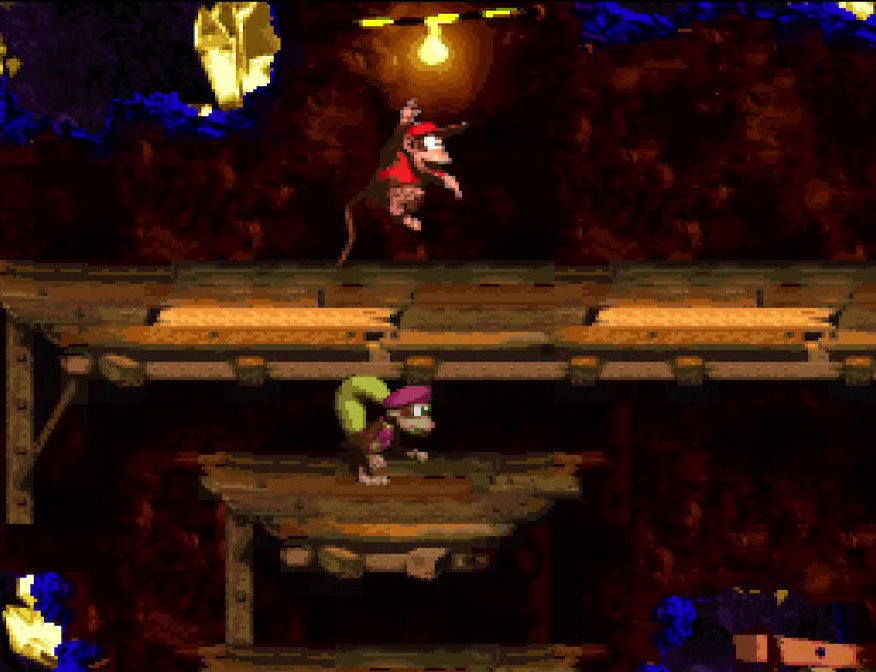
As a child, I loved to play Donkey Kong Country 2: Diddy’s Kong Quest; as an adult in my early thirties, I still love playing it. One of the reasons, among many, why is the game’s character movement feels almost perfect. Never do I feel as though I can’t adequately control Diddy or Dixie Kong as I navigate them through many levels of perilous adventure. As a game designer, I found myself wondering: what is it, exactly, that makes me love DKC2’s movement so much?
To answer that question, I’ll take a close look at the action verbs DKC2 employs related to the player characters. It’s not just a matter of analyzing the actions and movements in and of themselves, however; the level and enemy design of DKC2 are intentionally crafted to augment those basic and special actions. As is undoubtedly true for many games, it is the whole package together which creates that feel I love so much.
In the first part of this blog series, we looked at the many abilities and forms of movement the Kongs can do; in the second part, we examined the design of the levels those actions are performed in, and how it compliments them. Now, we’ll look at the final segment of the movement equation: the foes the Kongs must fight throughout the levels. We’ll review the types of enemies that get included in the game, relative to how you are expected to deal with them; next, we’ll examine a few foes that implement some special mechanics on top of their base type; finally, we’ll look at a few levels to see how enemies are placed to take advantage of the Kongs’ movement, their movement, and the level’s design to create compelling, challenging gameplay experiences.
Kantankerous Kharacteristics
When asked about what kinds of enemies are present in Donkey Kong Country 2, one might say “there’s some ground enemies, flying enemies, swimming enemies, some bosses”. That isn’t wrong at all, but I want to approach this from a different perspective; I want to examine enemies by how they are designed to be defeated. This approaches helps us focus on what moves you need to employ to defeat a baddie, which makes it well-suited for this design dive.
Basic Baddies
Many of the baddies are designed to be beaten with one or more of the regular moves in the Kongs’ arsenal. Some specifically protect themselves against particular kinds of moves, forcing you to be more strategic about how you approach them. Let’s break those types down.
Stomp Enemies
As is true in many platforming games, there are many baddies which can be defeated by jumping on their heads and knocking them off the stage; I’ll call this “stomping”. It’s usually pretty obvious which foes can be stomped; they lack any sort of visible protection to their heads which might discourage you from jumping upon them. That doesn’t mean all stompable enemies are the same; there’s plenty of variety to enemy widths, which affects how easy it is to land within their hurtbox. For example, Sneeks and Flitters have quite wide hurtboxes (and they are visually long-looking characters to communicate this), making them relatively easy to land on; other foes, like the Klomp, stand upright and present a smaller hurtbox, and thus are more of a challenge to land on precisely.
I use the term “hurtbox” to mean the collision area where contact results in hurting the entity possessing it.
Stompable enemies are sometimes placed in such a way that you can chain jumping on multiple of them in a row. As discussed before, this is used in some places as the required means of progressing through the level, but it’s also included in less critical areas as a fun thing to do. Jumping as you land on top of an enemy provides a boost to your jump height, which adds to the thrill of the action. Since jumping on enemies is a core part of the game, adding elements like this to increase the fun factor goes a long way to making the game feel good to play.
Spin Enemies
The spin move is also usable as an attack, careening into enemies to knock them away. Unlike falling on a baddie from above, using a spin requires knowing how much time you spend in the spin animation before breaking out into a run, as otherwise you’ll instead run into the enemy (and thus take damage and lose the Kong you control). This makes the spin attack more challenging to pull off, but subsequently it feels a little more satisfying to use than a simple jump attack.
When you successfully spin into a baddie, it actually resets the spin to the initial frame of the spin move; since the camera stops moving forward as part of this, it adds some weight to how the spin attack feels, contributing to the fun of using it. To compliment this, some parts of the game place multiple enemies close enough to each other that you can easily spin through the entire group, which is tremendously entertaining!
This is actually something I don’t think is done as well in Donkey Kong Country: Tropical Freeze. There’s been a lot of times in that game where I’ve tried to pull off a spin attack through a group of enemies that seem close enough to spin fully through, only for my spin to come up short in the middle of the combo through no perceived fault of my own. It makes it such that I trust the use of that attack less than the jump. That’s a shame, since I think DKC games are at their best when the player is able to use both forms of attack equally well.
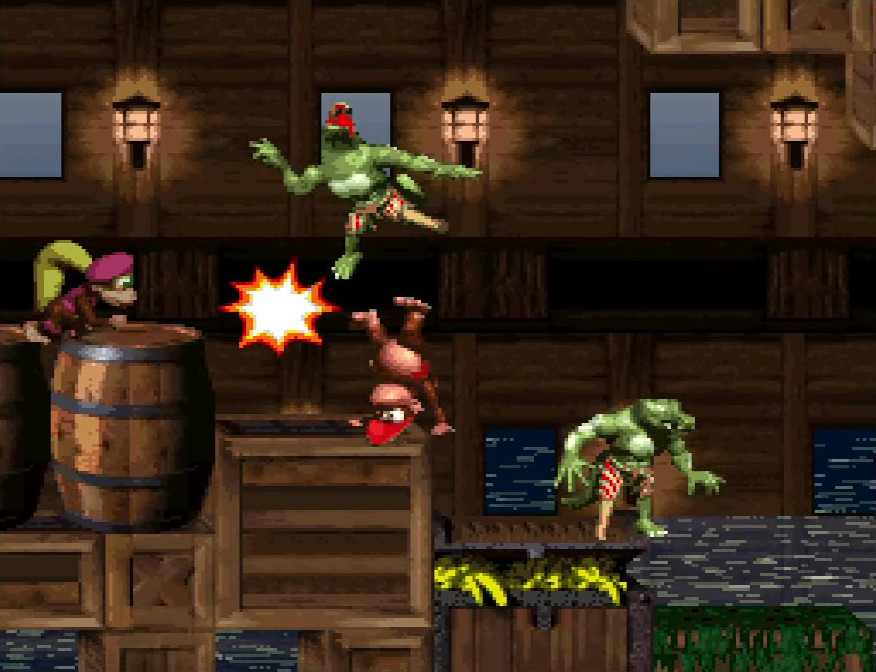
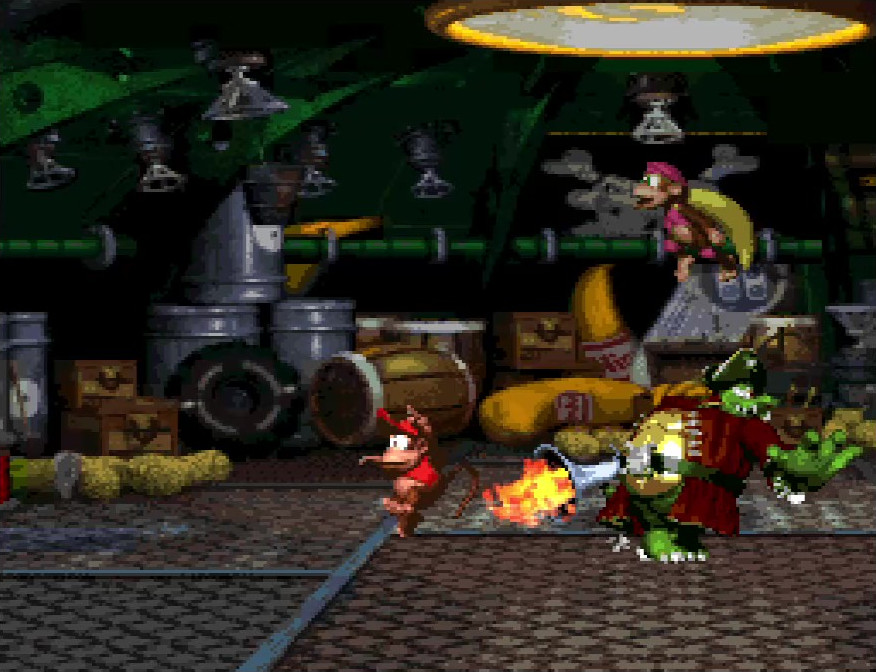
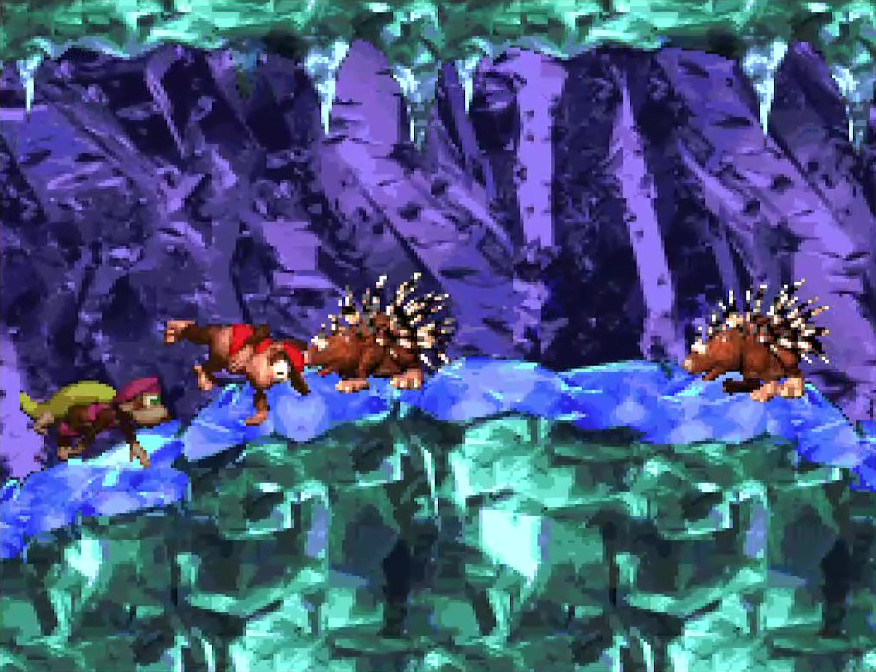
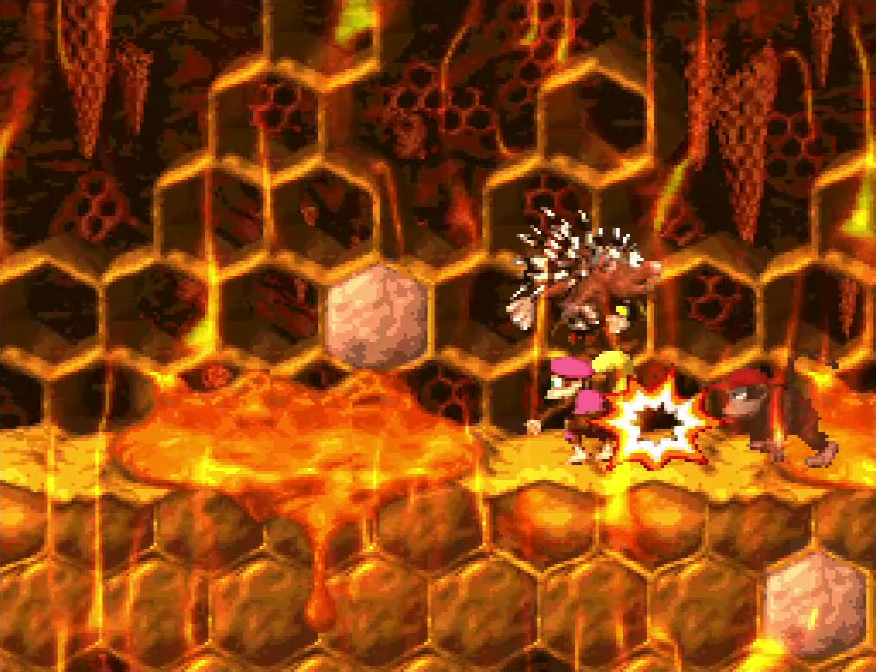
Many of the ground baddies which can be stomped on can also be spun into; some, however, specifically prescribe whether or not the spin attack should be used. The Spiny is designed to resemble a porcupine, bristling with sharp quills all over its body except for the exposed head area; spinning into this foe from the front is thus strongly encouraged. The Klampon, an alligator-esque foe with big, nasty teeth, communicates the opposite; spinning into those jaws means your death, so you must instead stomp them. This adds a level of depth beyond simply defeating these baddies; you need to understand what they are vulnerable to and specifically use the move which targets that vulnerability.
Protected Enemies
There are a few foes which are explicitly immune to the spin and stomp attacks the Kongs possess, meaning you can only defeat them with a projectile or an animal buddy’s attack. As mentioned in previous parts, that means when you are given access to a projectile or a buddy, you’ll need to keep them around long enough to deal with any protected enemies in your path.
What if you don’t have a projectile or an animal buddy? Then these protected baddies become obstacles which you must avoid. There are plenty of places in the game where this is what you are expected to do. For example, many climbing sections are littered with Zingers, forcing you to climb quickly or make well-timed jumps to avoid their patrols. On the ground, protected foes are often placed in ways that force you to perform a clever move (like a spin jump) to get through (or, alternatively, to access some form of reward that you’d otherwise have to pass on).
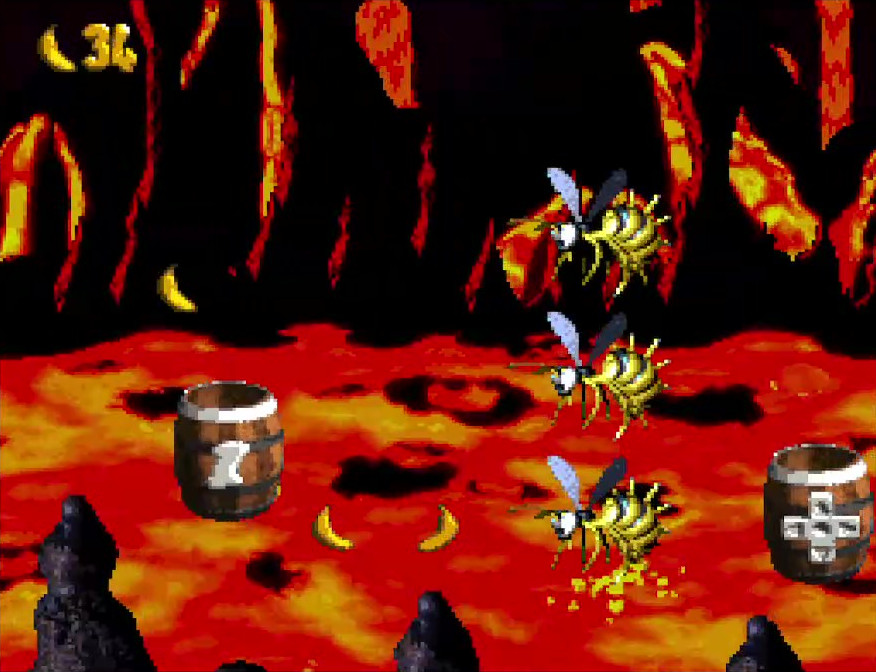
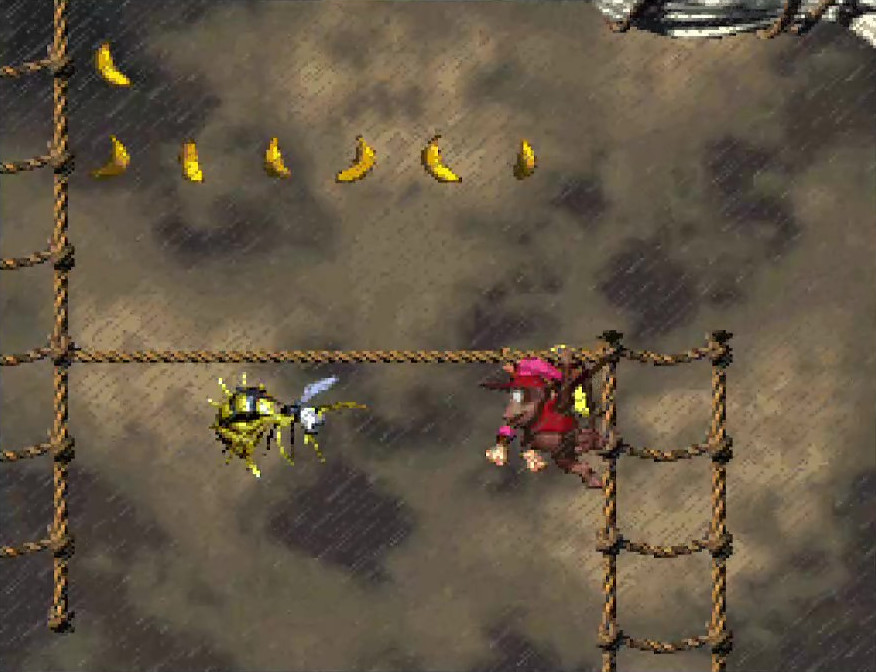
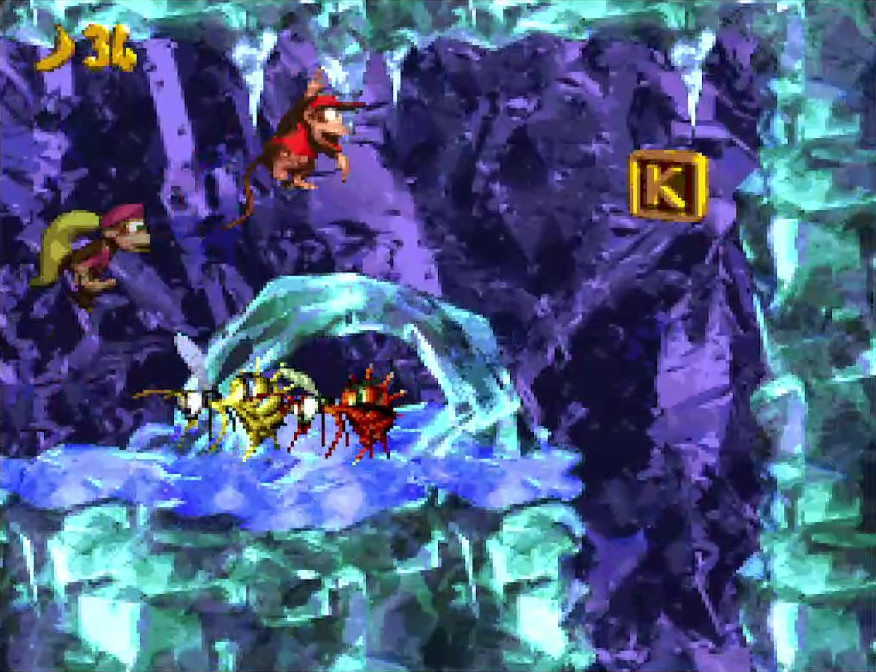
Enemies which are protected from spins and stomps are given a visual design that communicates this. The hornet-like Zinger is covered in sharp, triangular stingers, making it quite clear that death awaits those who try to spin or jump into it. Klubba is big and muscular, and the Kongs simply don’t have enough mass to do any damage to him; instead, when you try to jump on or spin into him, you bounce off him, and he turns red, making the next time you touch him cause damage. Kutlass sports a pair of oversized cutlass swords, and carries them in such a way that it makes it clear that he can cut you down from any angle you choose to try and attack. Identifying which enemies are protected from spins and stomps is an important part of gameplay, and forces clever use of your moves to either avoid them or keep projectiles and animal buddies alive long enough to get to those baddies and defeat them.
Komplex Kharacters
We’ve examined the basic archetypes of enemies by how they are intended to be defeated. There are a few special cases which differ enough from the basic types, which we’ll look into now.
Ranged Enemies
Most of the baddies in DKC2 use their brawn to try and hurt you, but a few fellows got the clever idea of shooting projectiles at you, instead. That forces you to keep your eyes peeled for when such baddies appear in the level, and react quickly to the projectiles they shoot at you to avoid them. Sometimes, these ranged foes are positioned such that they shoot projectiles through an area of the level you must pass through to make progress, requiring you to time your moves to the pattern of the projectiles so you pass while the baddie is reloading. Thanks to how responsive your basic movement is, dodging the projectiles, while a challenge, is rarely a frustration.
Even within the ranged archetype, there is variety to be found in what projectiles they shoot. The Kannon baddie (not to be confused with the samely-named Kannon that shoots you into bonus areas) sometimes shoots simple wooden barrels, which you can bounce on top of if you aim your jumps correctly; this is used in some levels as a required means of progression, bouncing across from barrel to barrel over a gap until you get to the other side. Other times, they fire iron cannonballs which hurt you irregardless of how they touch you, and you must simply avoid them. The Krook, meanwhile, fires its metal hook hands when you pass within line of sight; the twist is that those hooks function like boomerangs, returning to the Krook after reaching maximum distance, forcing you to not only keep an eye for the initial shot, but be prepared to avoid the projectile as it traverses its return trajectory. Finally, the Kloak hovers around and is capable of throwing many kinds of projectiles, from barrels and chests to Spinies and Zingers; sometimes, if you wait long enough and dodge the projectiles, a Kloak will throw out some form of goodie, like a banana coin or a chest with a 1-up balloon, so it’s not always in your best interests to kill them right away.
Swimming Enemies
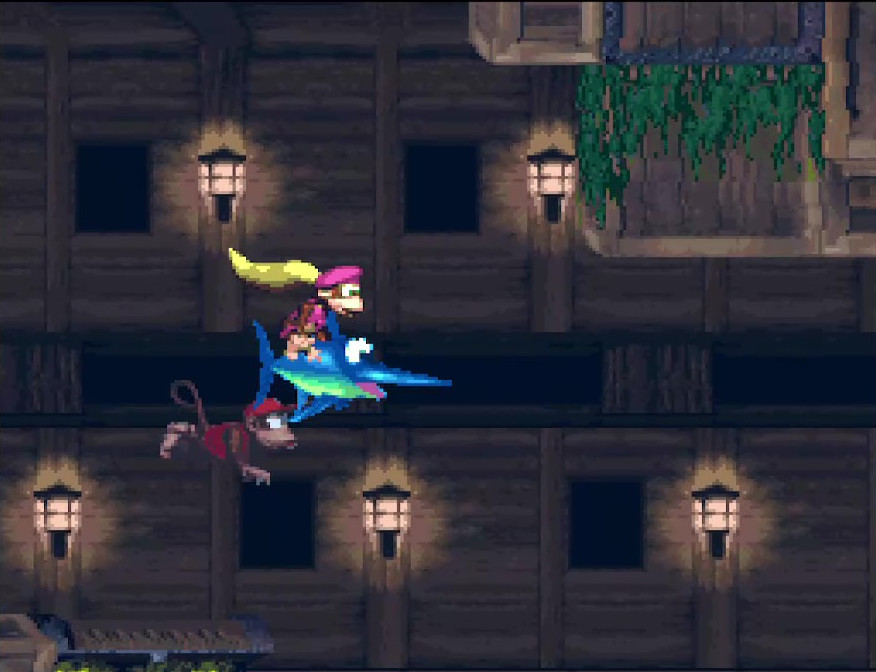
While swimming, the Kongs cannot jump, spin, or throw; this makes all the foes underwater a protected enemy, because touching them means death. Thus, underwater sections tend to evoke avoidance gameplay, where you swim carefully through rooms of patrolling baddies. Not every foe is content with simply patrolling, however; the Lockjaw, an orange piranha, will charge towards you if it catches you within its line of sight, while the Shuri, a spinning starfish, will wait for you to enter an area, then attempt to launch themselves in your general direction. The Puftup, a bloated pufferfish, will sometimes explode when you get within range, launching its sharp spikes in predetermined directions and forcing you to dodge to avoid them.
Both the Shuri and the Puftup also have variants which simply patrol an area, so you have to identify which variant you’re facing when they appear on-screen!
A lot of times, in swimming levels, Enguarde the swordfish is hidden somewhere, and using him makes the underwater sections far easier. Instead of having to avoid every enemy you see, you can instead line up Enguarde’s sword bill to stab them and take them out. As mentioned before, it’s a reward for players who explore levels carefully and check the nooks and crannies for hidden passages.
Bosses
Boss fights are the apex stage of every world, the final challenge that you must overcome to progress to the next world area. All bosses are immune to stomps and spins, being vulnerable only to projectile attacks. Often, the projectiles you need aren’t immediately available to you, requiring you to wait for them to appear. These big baddies aren’t content with sitting around and letting you get those projectiles freely, however; they have many forms of attack in their arsenal to use on you. These attacks are patterned, so you can learn how a boss is going to attack you and develop strategies for dodging them. Even when you acquire the projectile, however, you still have to aim correctly to get the projectile to hit the baddie, or you’ll have wasted your shot and made the boss fight take longer, increasing the odds that you’ll make a mistake and take a hit.
The stages you fight each boss on ask for the use of different abilities as part of the pattern avoidance. Krow, the foe of the first world, flies around the stage and tries to drop eggs on you, some of which can later be picked up and thrown back at him. Kudgel, the gatekeeper of World 3, jumps around the stage and tries to land on top of you; when he hits the ground, anything standing on it is paralyzed, so you not only have to run around to avoid getting landed on, you also have to jump in the air to get off the ground to avoid being unable to respond to his next jump. To fight King Zing, the defender of the fourth world, you transform into Squawks and must not only dodge the king’s flight path, you must hit a specific part of his body (the tail stinger) with your egg projectiles in order to cause damage. Even though the underlying pattern of dodge-the-boss-until-you-can-use-your-projectile is the same for all boss stages, the different takes on that pattern keep the gameplay fresh and interesting, while requiring you to make good use of your movement to win.
This was a notable issue with bosses in the original Donkey Kong Country, where nearly every boss had to be fought in the exact same way, by simply jumping on them.
Special Shenanigans
There’s more to a good foe than simply meandering around a level. A few simple stooges like that are useful for establishing a baseline to gameplay, but often, as game designers, we want to make enemies that take expected archetypes and add an unique twist for the player to deal with.
Donkey Kong Country 2 does this with many of its foes; even though the baddies can be classified into a small set types of how they can be beaten, most still get one or more unique traits that make it more interesting to deal with them beyond a simple spin or stomp. We’ll examine a small subset of DKC2’s roster of baddies, observing the mechanics which make them function and how they engage with the moves given to the player.
Neek
We’ll start with the humble Neek. A small, bandana-bearing vulture, Neek hovers at a predetermined area in the level and waits for you to get near. Once you enter his threat radius, he lets out a screeching cry and dives down a planned flightpath, starting with an arced curve and flattening out into a straight line. You need to quickly predict where that flight path is going, and whether you’re in it. If you are, you’ll need to duck or jump to get out of the way. If you want to remove the Neek, you can jump up and stomp on its head as it flies by.
As far as special mechanics go, this one is relatively simple. Even so, it adds an element of intrigue to how you plan to deal with him. Until you enter the threat radius, he doesn’t move, so you can’t wait him out; on the other hand, since it won’t attack right away, you have time to prepare for your reaction. While all Neeks perform some form of dive and flatten out maneuver, the angles involved can vary with each Neek, so you have to figure out quickly what kind of pattern it’s going to adopt. Thus, even though the dive isn’t that complex a behavior, the Neek’s simple mechanic is still enough to provide interesting, fun gameplay.
Click-Clack
A small, yet oversized, dung beetle, the Click-Clack has a small hitbox to accompany its tiny frame. This makes it so that you have to be more precise with your jumps in order to land on them. Additionally, when you jump on one, it flips onto its back instead of becoming defeated; you’ll also get knocked back a little bit. If you ignore that Click-Clack, it’ll revive and move around faster than before; only a second jump will dispatch it for good. On the other hand, while it’s flipped over, you can pick it up and throw it as though it were a projectile (although throwing it down to the ground will cause it to revive). Finally, if you spin into it, you defeat it instantly.
There’s all sorts of interesting gameplay that arises from the Click-Clack’s mechanics. The knockback force you experience when you jump on a Click-Clack can make the stomp a little risky; that force could push you into another enemy, or into a pit. Spinning into it, where you have room to do so, is certainly the safest way to dispatch them. On the other hand, it can be used as a projectile; if you’re about to face a horde of enemies, particularly ones that are protected from your other attacks, it’s well worth your while to stomp on a Click-Clack for the purpose of carrying it around as ammunition (or a shield, since holding projectiles protect you from damaging attacks to your front). You can’t sit around and wait while it’s on its back, however; you have to decide whether you’re going to kill it or carry it, or it’s just going to get up again, and since it now moves faster it’ll will be more deadly to deal with.
If you look at the Click-Clack in terms of how it is beaten, it’s a spinnable, stompable foe. The small hitbox and unique mechanics around what happens when you stomp on it make it a much more interesting, versatile foe to fight than it might otherwise be.
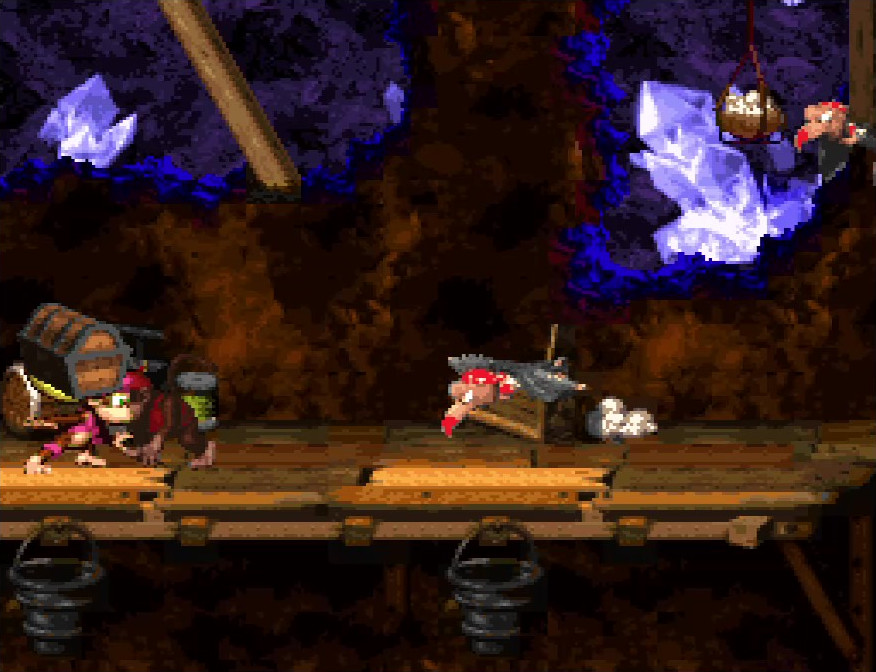
Klobber
The Klobber is a Kremling that hides in normal-looking barrels. When you get close enough to it, the Klobber will pop up and try to run into you, knocking you around if it succeeds in doing so. The fact that baddies in barrels exist means you have to be cautious whenever you see a barrel; is it only a barrel, or is a Klobber hiding within? Oftentimes, Klobbers are placed around other enemies or hazards, making it easy for you to get shoved into a source of damage.
How do you stop the Klobber? You have to leap into the air and stomp on its head; spin attacks do nothing against it. Once it’s been stomped, it hides inside its barrel for awhile before popping back out to charge after you anew. The only way to prevent it from returning is to pick it up and throw it into something and break, or offscreen into the bottomless void. You don’t need to throw it right away, though; you can carry the Klobber’s barrel around, and it functions exactly like a regular barrel. Like the Click-Clack, that makes the Klobber a source of projectiles, making it worthwhile to deal with one.
There’s more than one kind of Klobber, too. Different-colored Klobbers have different effects when they hit you. The green Klobber just knocks you around; the yellow Klobber steals bananas from you, which disappear if you wait too long to recollect them; the black Klobber takes away life balloons, which float away if you leave them alone. The red Klobber hides in TNT barrels—with the special name Kaboom—and blows up if it runs into you. These increasingly deadly side effects heighten the stakes of engaging with them; be careless, and you could lose valuable life-giving resources (or, in the case of Kaboom, your life).
Kutlass
Finally, we’ll bring up Kutlass. We’ve briefly mentioned it already; it’s the double-cutlass-wielding Kremling. Those oversized swords, as mentioned before, make it clear that jumping on the Kutlass is a suicidal maneuver. What about spinning into it from behind? It’s too smart; as soon as you get close, it’ll turn to face you and charge at you. If you don’t move out of the way, those massive cleavers will come down on your Kong’s head and take them out of the picture. The only option you have, if you don’t have a projectile, is to dodge out of the way. When you do this, the force of Kutlass’ swing gets its cutlasses stuck into the ground for a few moments, exposing an opportunity to strike and defeat it, either by stomp or spin.
This enemy is an unique blend of the protected and basic types, and this makes it interesting to engage with. You need some amount of space where you can get near the Kutlass without getting immediately into its threat radius; otherwise, you have nowhere to dodge when it swings the swords at you. Even if you do have enough room to dodge, you have to react quickly, making the Kutlass a test of how well you’ve mastered using your movement over the course of playing the game.
Level Design Kase Studies
Having baddies, no matter how interesting they may be, is nothing without creating level designs that take advantage of how they behave, just like having good movement is nothing without a level design that makes those moves fun and entertaining. As with many other aspects, Donkey Kong Country 2 does a great job with enemy placements in its levels, starting with simple schemes to ease new players in and ramping up to complex challenges that truly test a player’s mastery of their moves.
There are a total of 40 levels in the game, each with enough depth to go many thousands of words into. For the sake of brevity, however, we’ll restrict our gaze to portions of a few levels. Even these microcosmic glimpses should prove illuminating as to how well DKC2 uses enemies in its level design.
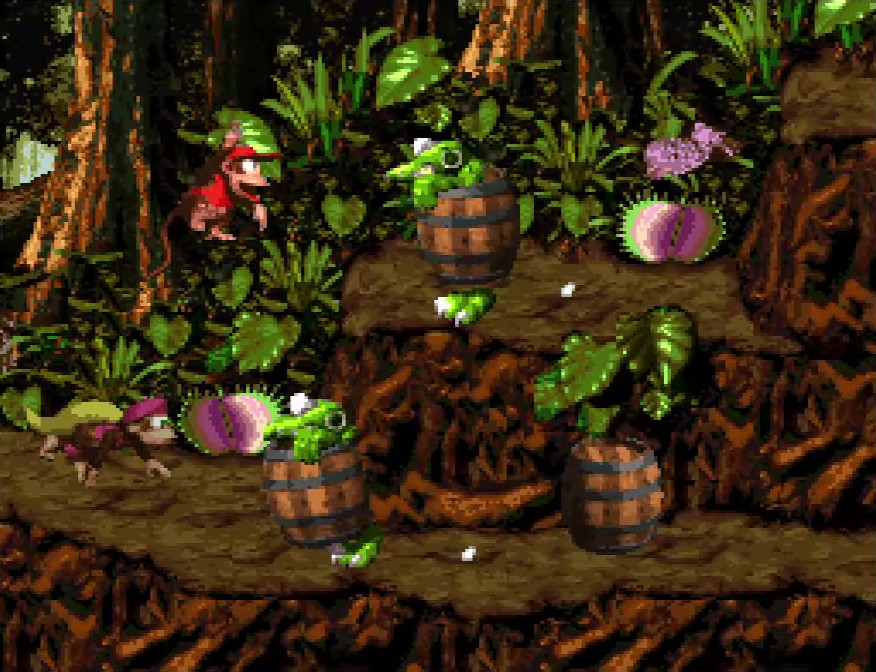
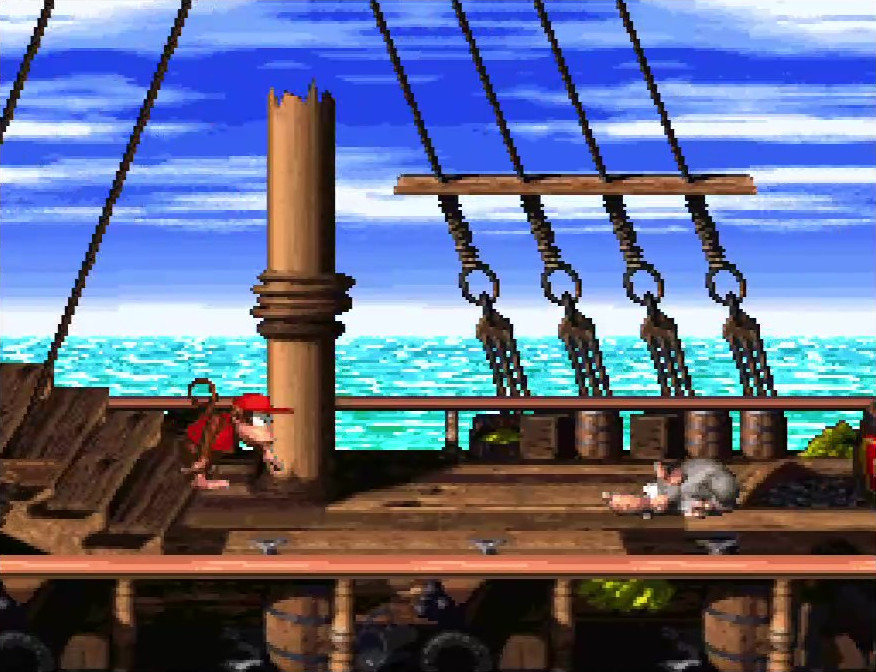
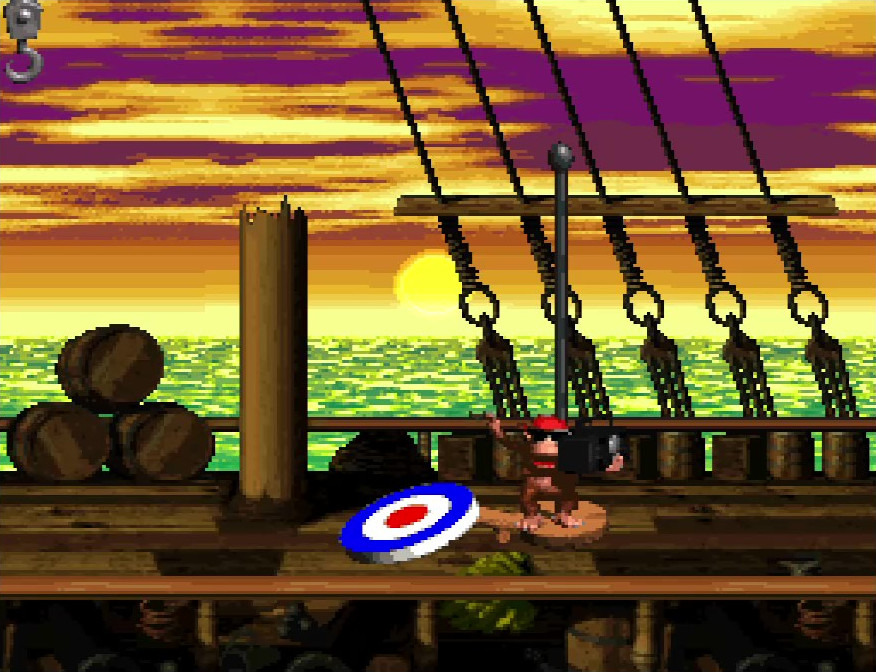
Pirate Panic
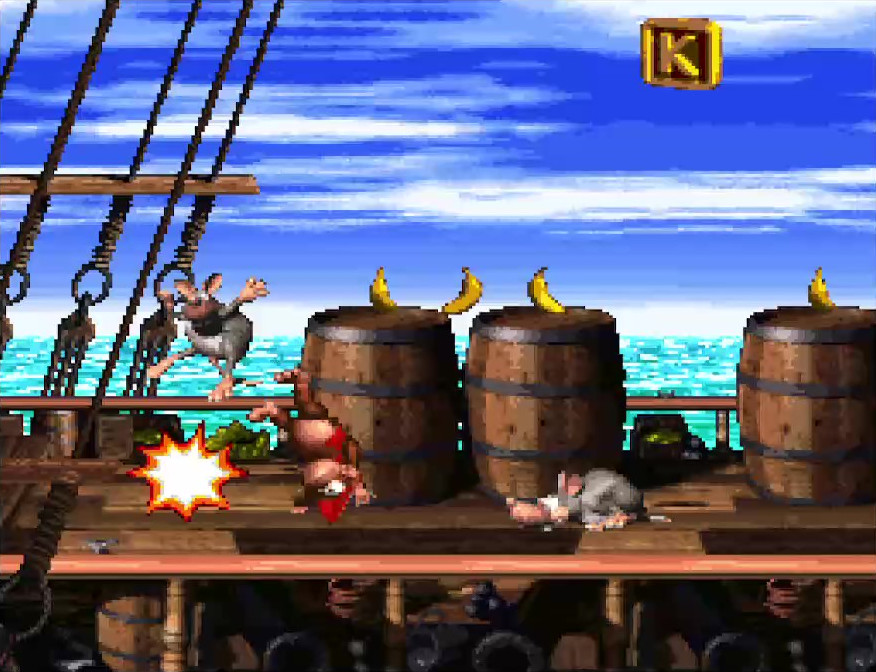
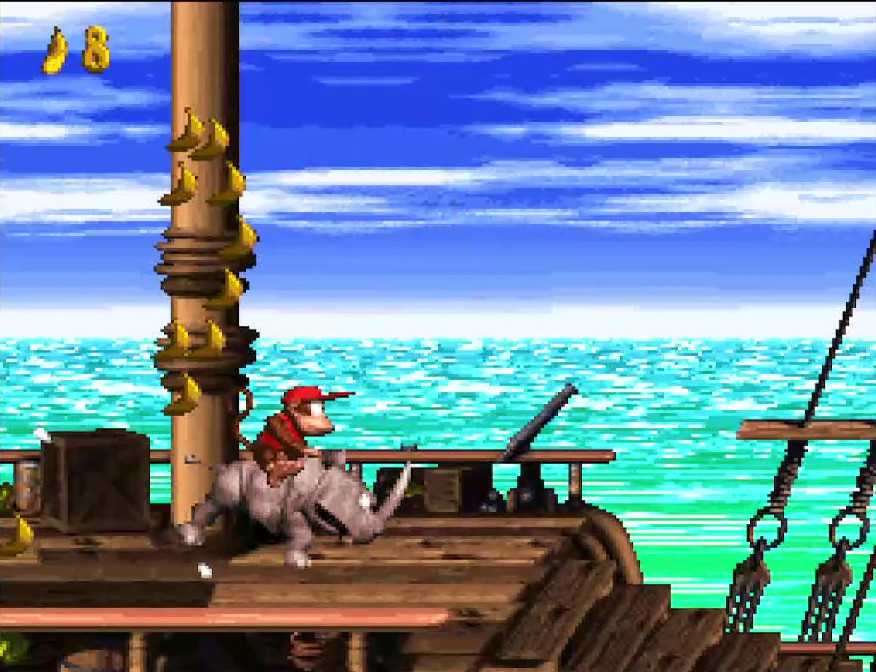
We’ll begin at the beginning: the first level of the game, Pirate Panic. As is typical of the first level of many games, Pirate Panic is designed to introduce you to the many mechanics you’ll be using for the rest of the game. Fittingly, the first enemy you come across is a Sneek, who is easy to jump on and moves slowly; he’s just begging for you to jump on him or spin into him.
Having the first enemy you encounter be simple, easy, and uncomplicated gives the player less to worry about. The Sneek isn’t going to suddenly rev up speed and charge into you, or jump super high out of nowhere; he’ll just keep moving your way until you either deal with him with your moves or let him run into you. It’s a great way to introduce the basic moves to you.
You encounter a pair of Sneeks as your next foes; you’ve already learned how to deal with one, so now the game asks you to deal with two of them. Hopefully, knowing what to do, this proves to be an easy task for you.
Afterwards, the next foe you see is the plodding Klomp. This is a new baddie, with a differently-shaped profile (and hurtbox), but the way you deal with him is the same as how you dealt with the Sneek; the jump just needs to be a little bit higher. Alternatively, if you’ve happened to learn how to hold down the Y button to run, you’ll pick up a crate projectile right before you see the Klomp. It’s not far-fetched to think from there that you might be able to throw this at the Klomp, or even hold it to run into him.
This Klomp is also on top of a row of platforming barrels, so you could even choose to run underneath him if you don’t feel like engaging him. It’s also an introduction to enemies on different height levels, something you’ll encounter often throughout the rest of the game.
Once you pass the Klomp, the next baddies you have to contend with are a row of Sneeks, but this time there’s a twist: the foes are advancing beneath a bunch of stacked platform barrels (so named to distinguish them from projectile barrels). If you try to jump on them, you’ll most likely land on top of a barrel instead of the Sneeks, avoiding them entirely. If you just want to progress, that might be good enough; for many players, though, it’s irking to leave any foe undefeated, if it was within their power to handle. That row of barrels serves as a discouragement against jumping, in that case. The way to defeat these Sneeks is spinning into them; hitting the first one will result in demonstrating the fun art of spinning through all the nearby enemies, exposing a new strategy for you to use and cementing it in your brain with a rush of fun gameplay.
By now, you’ve had multiple chances to practice your basic moves. The rest of Pirate Panic continues in much the same way, introducing slightly more challenging scenarios and foes, giving you a great taste of the gameplay to come.
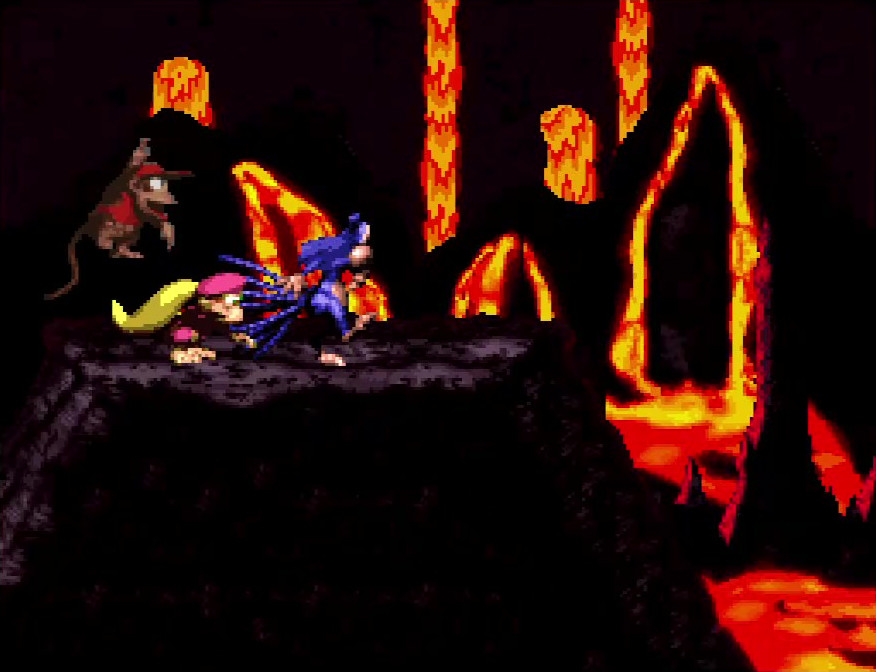
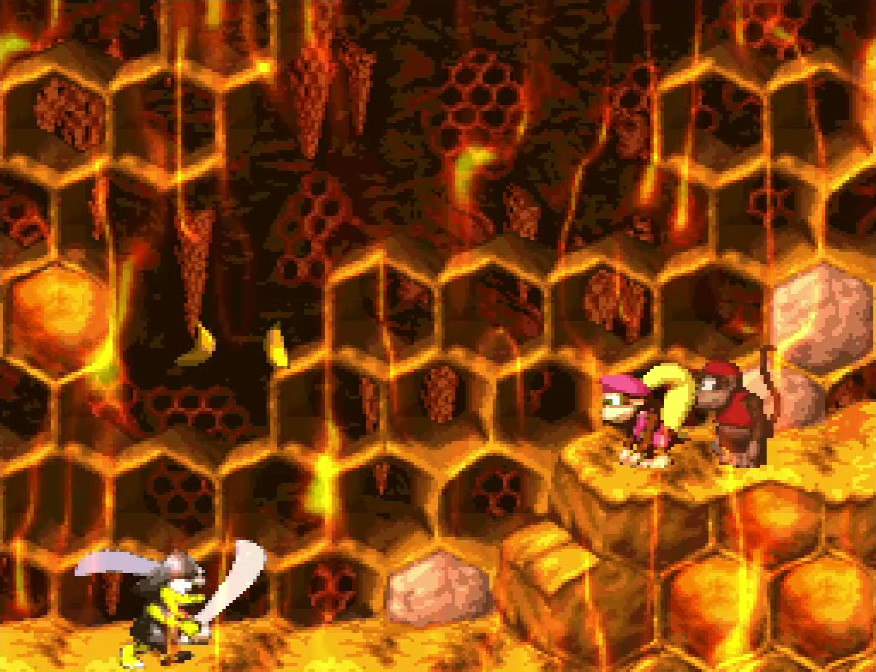
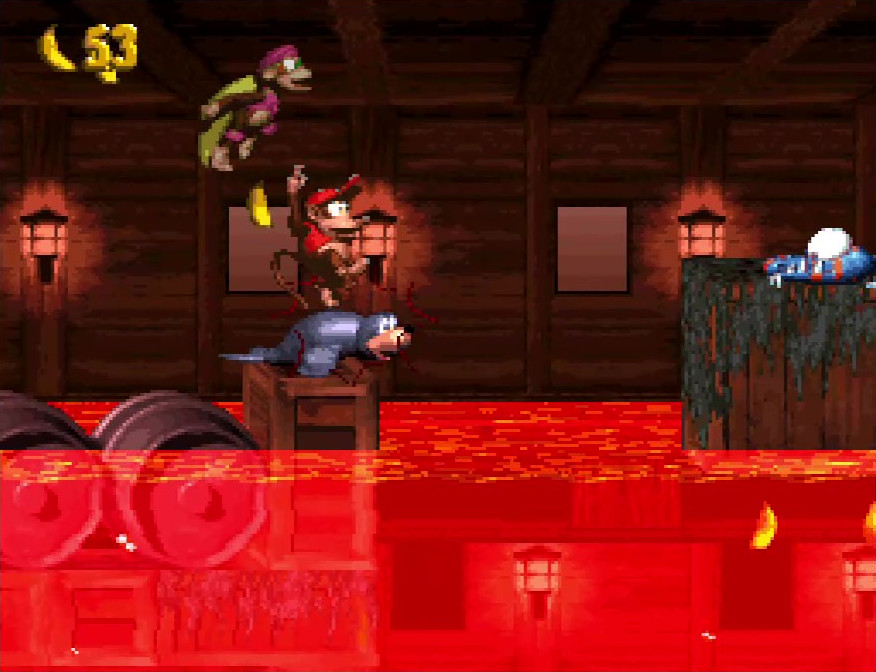
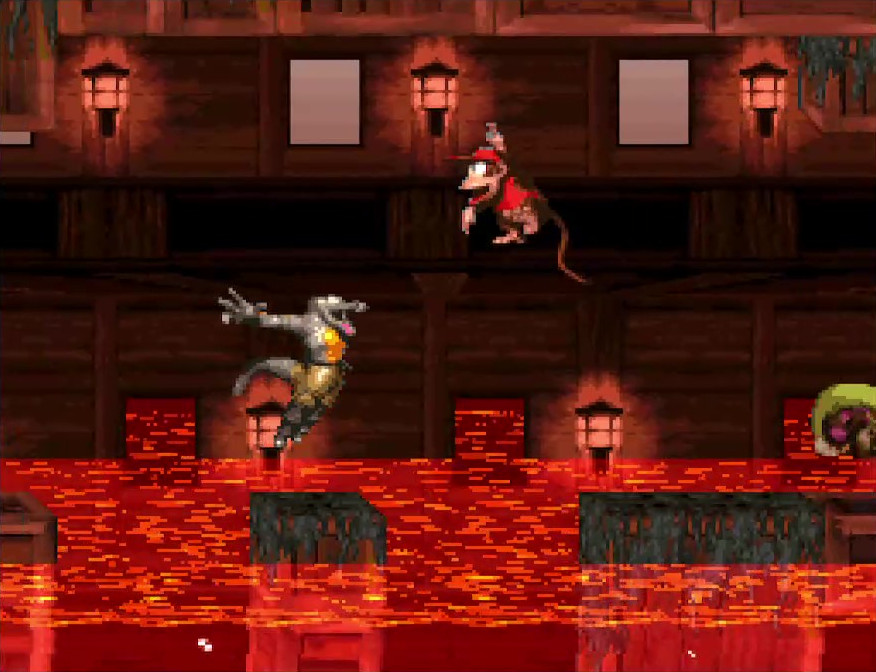
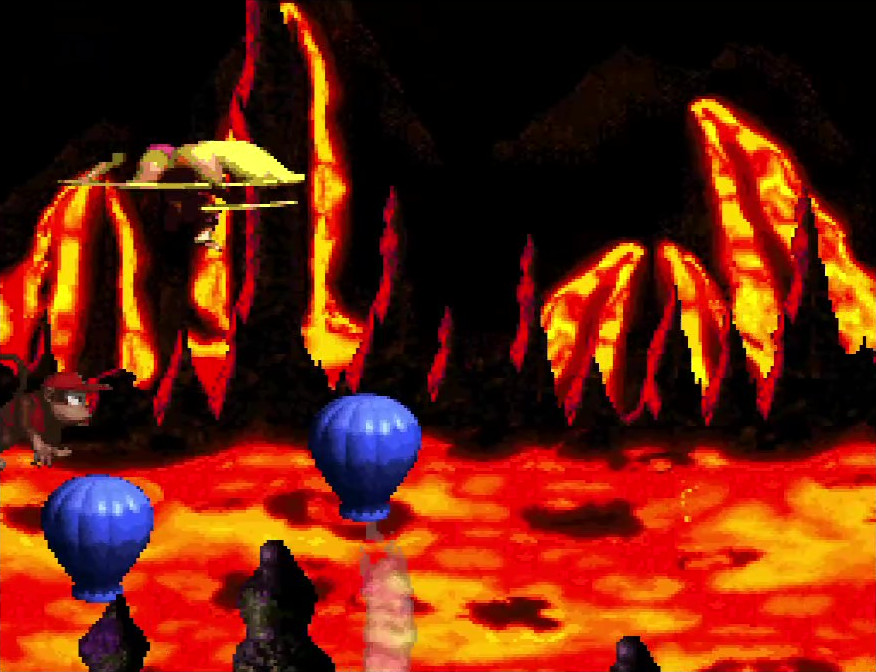
Lava Lagoon
Next, we visit Level 3 of World 2, Lava Lagoon. This is the first time a level gimmick gets introduced: the water is, literally, lava, and you must jump on the back of an all-powerful, almighty seal named Clapper to convince him to turn this lava into water, making it safe for you to traverse. You can’t stay in the water too long, however; after a brief period of time the water will start heating up, until it once again becomes lava.
If Clapper is powerful enough to turn lava into water, why doesn’t he help the Kongs out in more substantial ways? Good question.
The way this level gimmick is introduced is clever. You are presented with a small branching path. At the start of this fork sits Clapper, waiting for you. The path above is patrolled by a Klampon; the path below is lava-logged and, at the moment, impassible. Earlier in the level, you had to contend with a Sneek approaching you from a higher platform, so that jump to the upper platform feels dangerous. Meanwhile, Clapper the seal is barking at you, and, given how often jumping on things solves problems in this game, you’ll probably feel inclined to do the same here, just to see what happens. Thus, you discover Clapper’s magical powers of liquid and temperature transmutation, making the lower path accessible to you. It is far easier to swim through this area, so you’ll likely take it over the upper path.
This fork in the road thusly introduces the level’s gimmick to you in an intuitive way, inviting you to figure it out on your own. Even if you ignore Clapper entirely and brave the upper platform, it’s not a big deal; you’ll soon reach a point where you cannot progress further without using Clapper. Seeing him multiple times increases the odds that you’ll engage with him and figure out his shtick.
One other thing that underwater path teaches you: that you’ll have swimming enemies to contend with underwater, as a lowly Flotsam patrols the floor of the lower path. It’s easy enough to swim above him, but it prepares your expectations for what kind of gameplay is to come.
The rest of Lava Lagoon is an increasing progression of a simple pattern: introduce lava-water sections that you need to cool down with Clapper, then travel through before the water heats back up to the point of damaging temperatures. In each water section, you have a cadre of underwater foes to swim past and dodge; the combinations become trickier and trickier to navigate the deeper you get into the level, ending with a mad dash through a maze of puffing Puftups (the non-exploding kind) to make it to the end of the level before you run out of time. For good measure, you also get tossed a Klobber at the level’s end that you have to avoid or defeat, lest it push you back into the lava. Overall, the level is a good example of taking a level gimmick, teaching you how it works, and ramping up the challenge of that gimmick through good enemy placements.
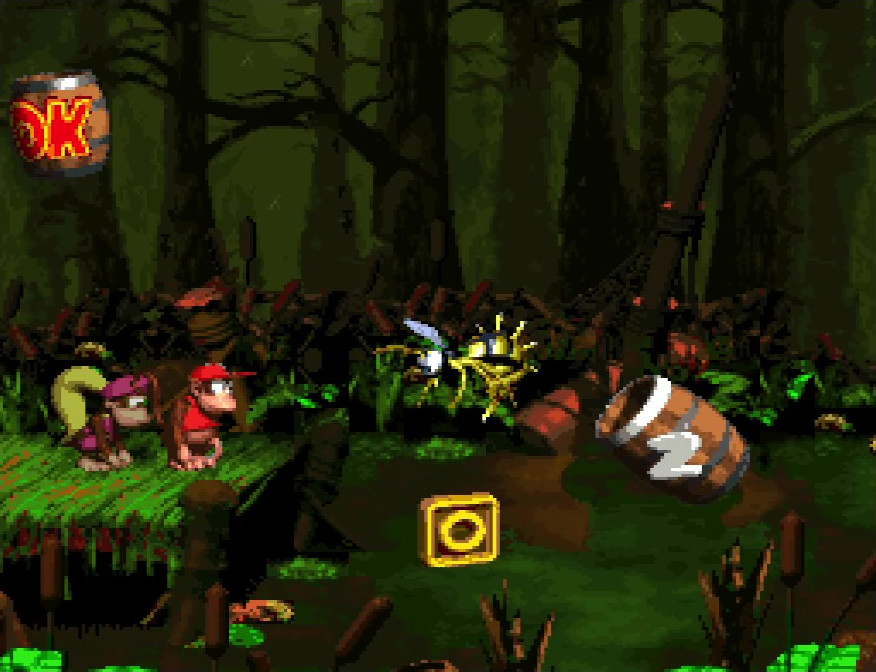
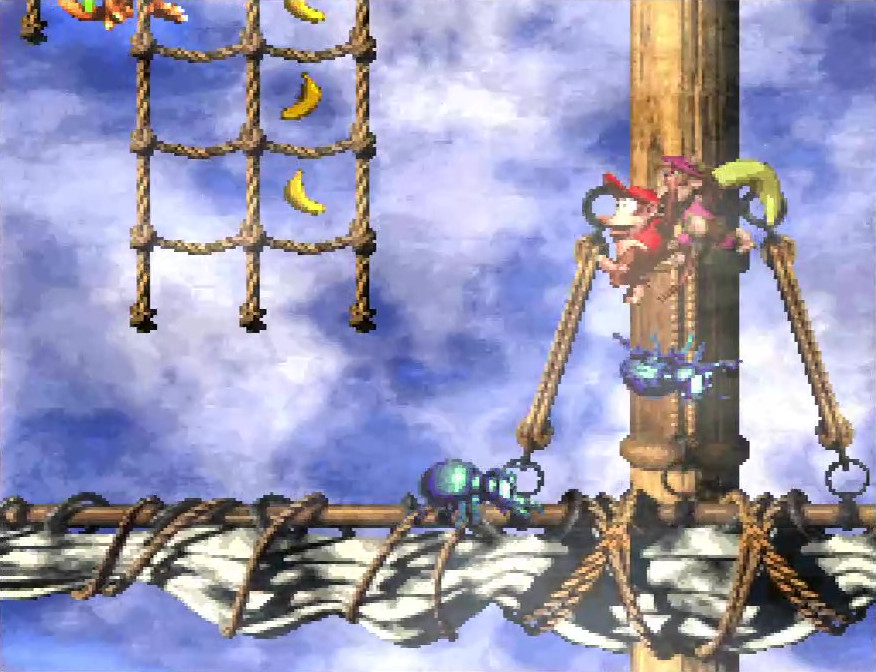
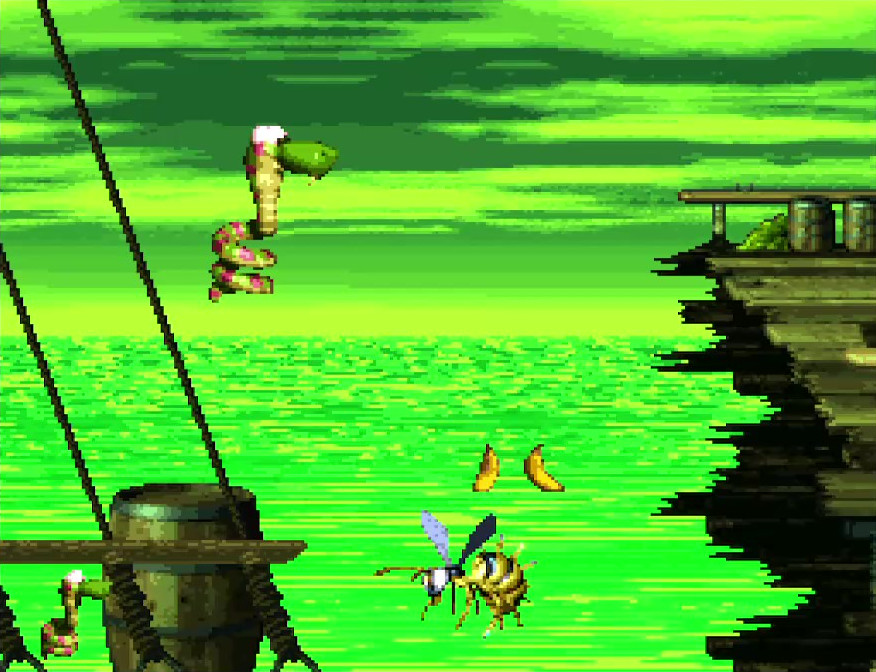
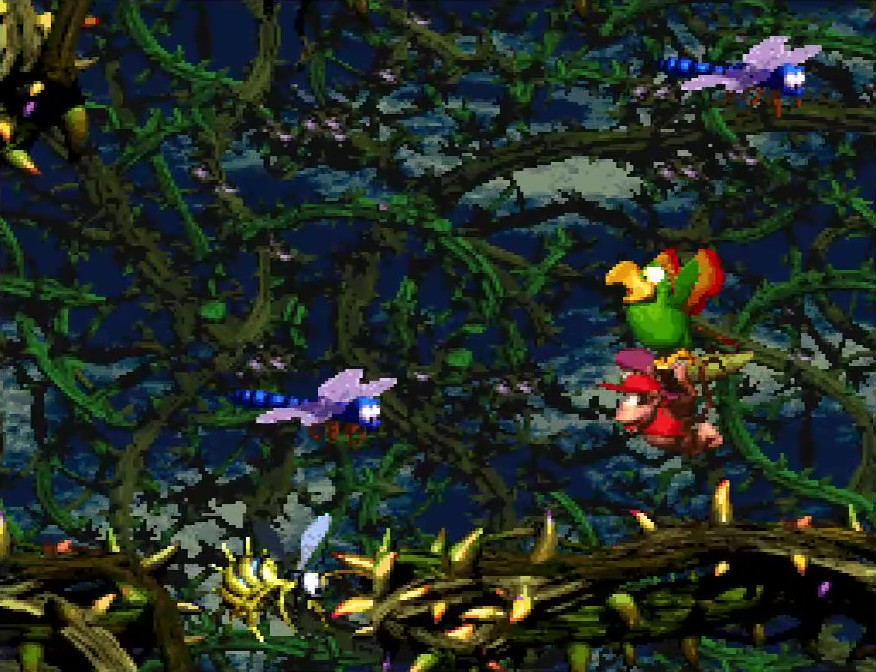
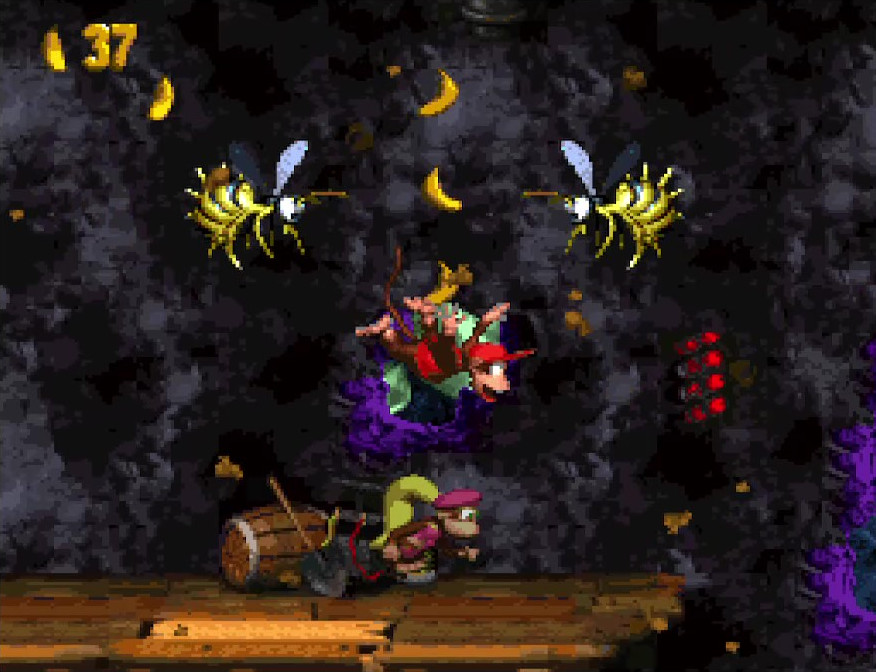
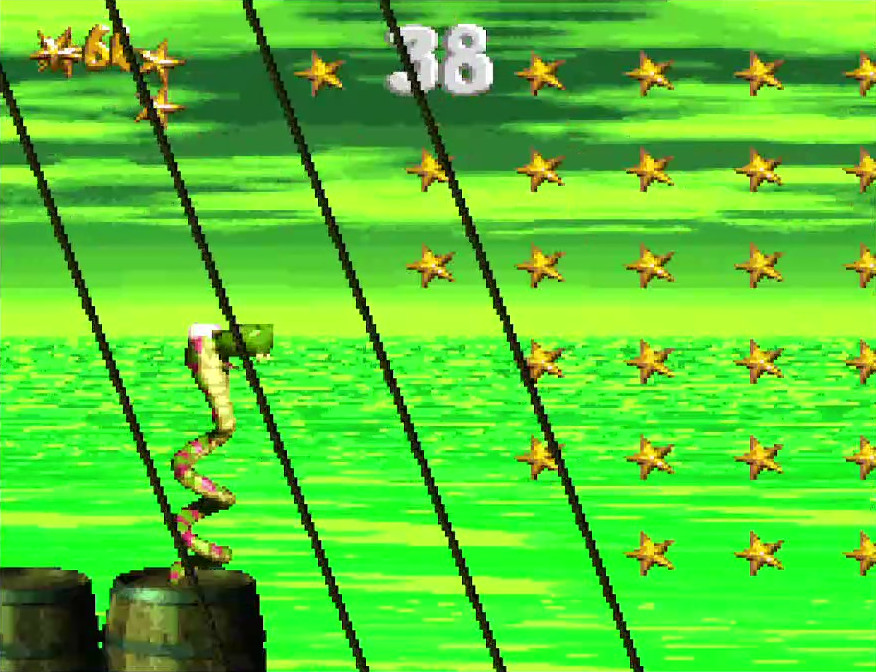
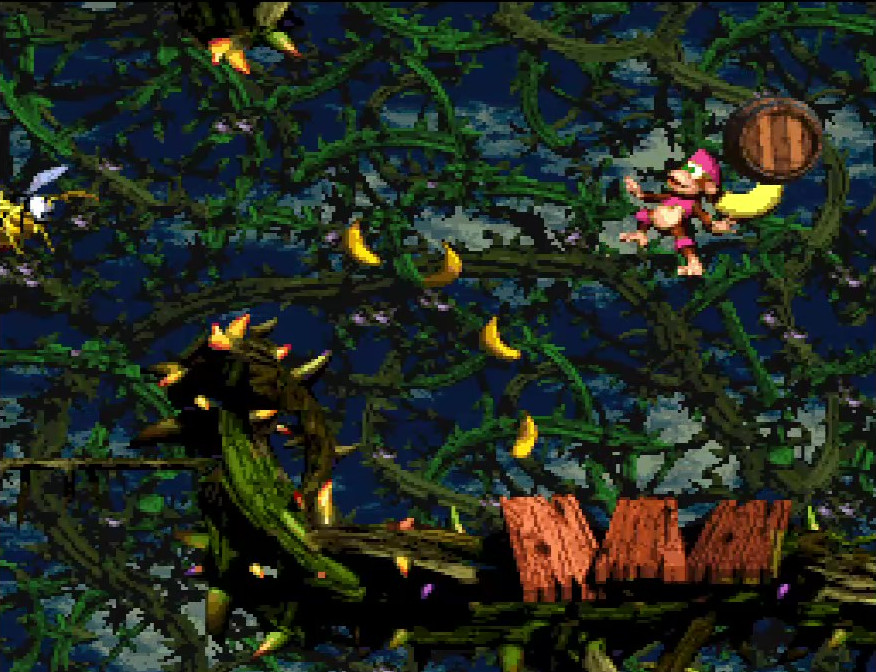
Bramble Scramble
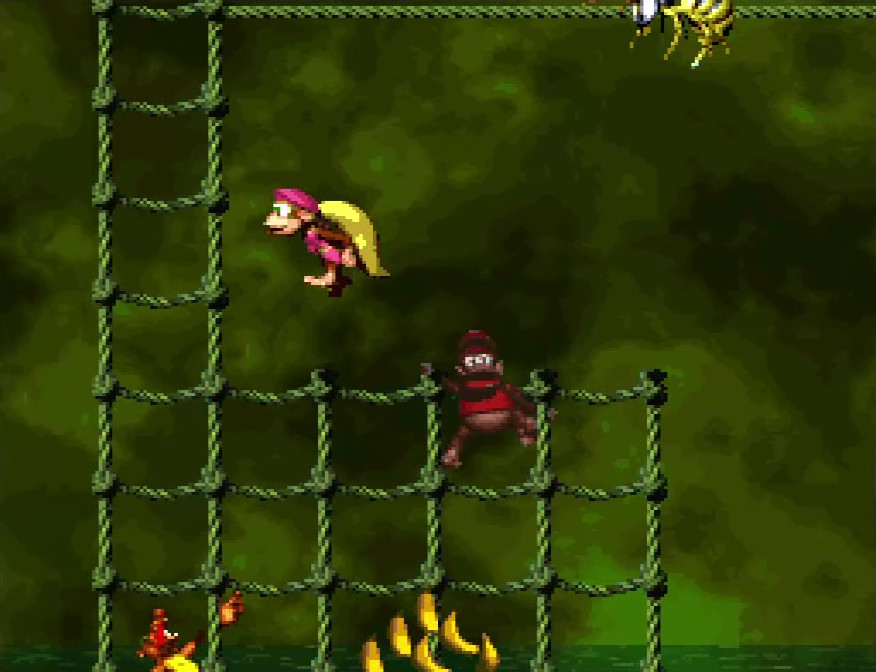
As you progress further into the worlds and levels of Donkey Kong Country 2, the challenges the game puts before you becoming increasingly more difficult. I think Level 3 of World 4, Bramble Scramble, is a quintessential example of the game giving you a great challenge to put all your skills to the test. This level is oriented both around climbing on ropes and flying with Squawks.
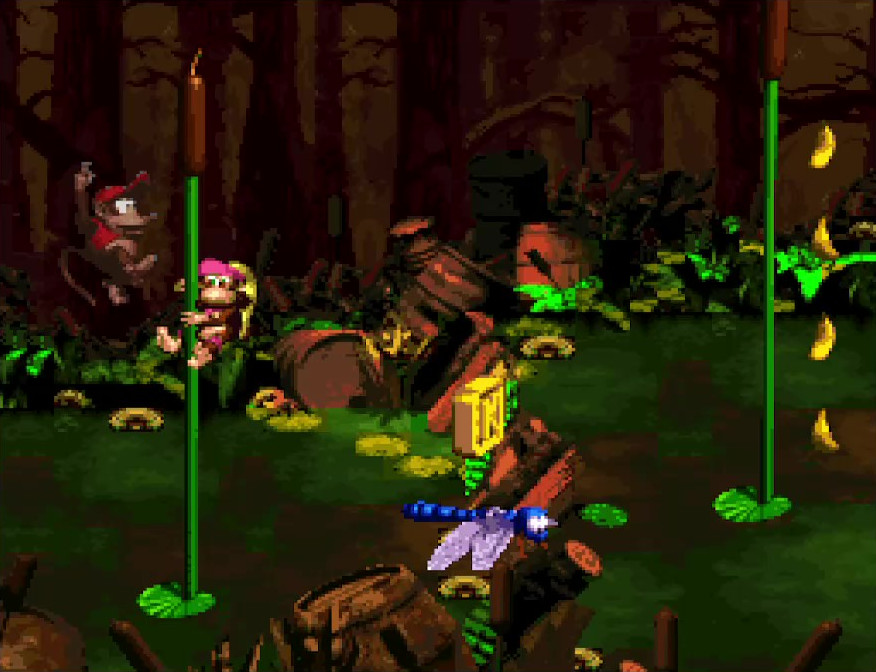
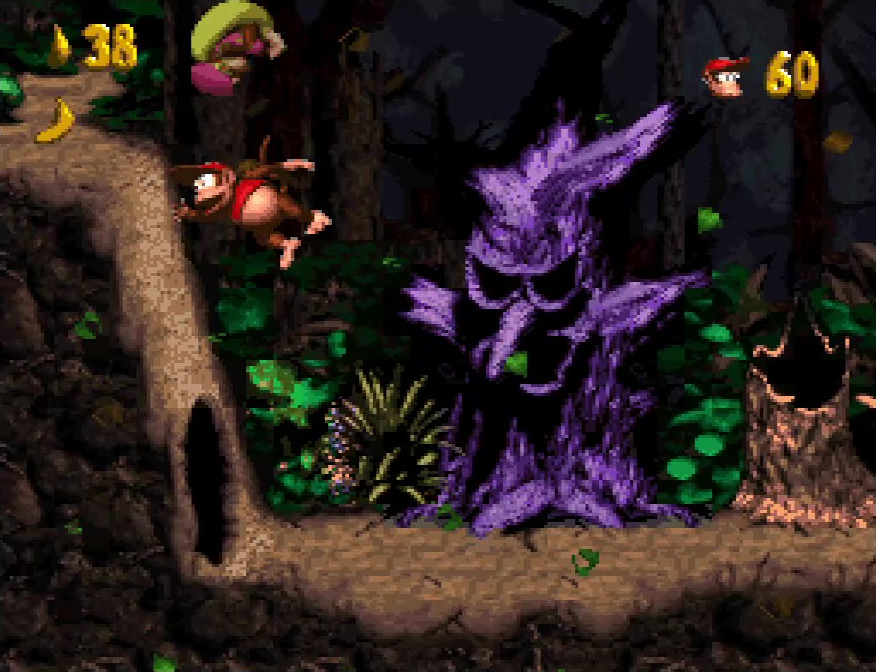
In the other two levels we’ve discussed, the opening enemy was something simple and easy to deal with. Not here; your first foe is a Krook, and you encounter him the moment you move forward in the level, needing to deal with his hook shot right away. Even if you beat him, though, he’s right on the edge of a thicket of brambles, so you have to be careful that your jump doesn’t lead you to fall into them. After a long jump to the next safe wooden platform, you’re faced with a tall, thorny vine, with a Zinger hovering on the other side waiting to sting you upside the face, assuming you manage to fly over the thorns without getting your Kongs’ butt pricked along the way. You get one DK barrel to try and take out the Zinger, and if you succeed your passage over the thorns is a little safer. The shot isn’t easy to make, however, and you only get one chance; the game is testing you to see how skilled you’ve gotten with your aim.
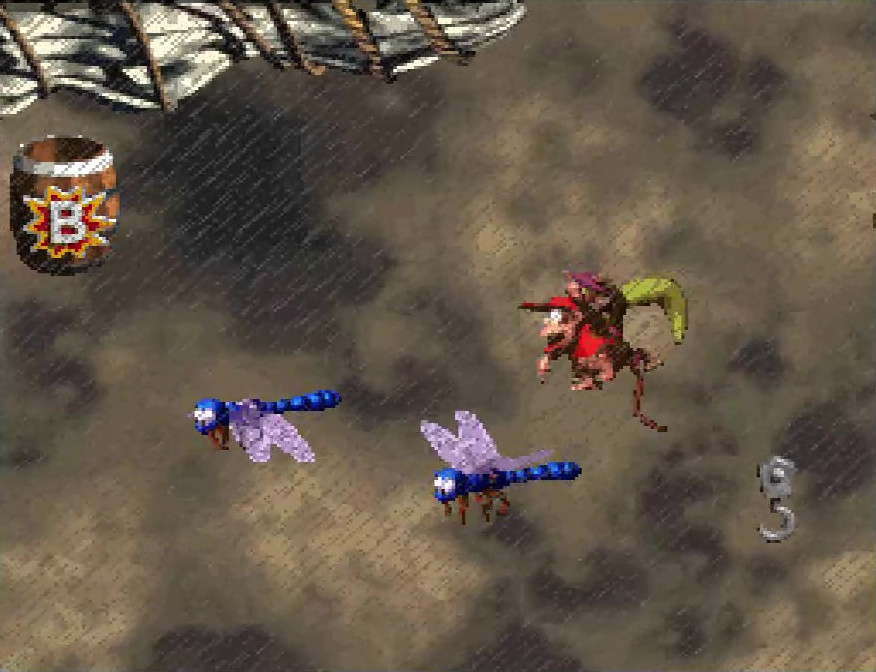
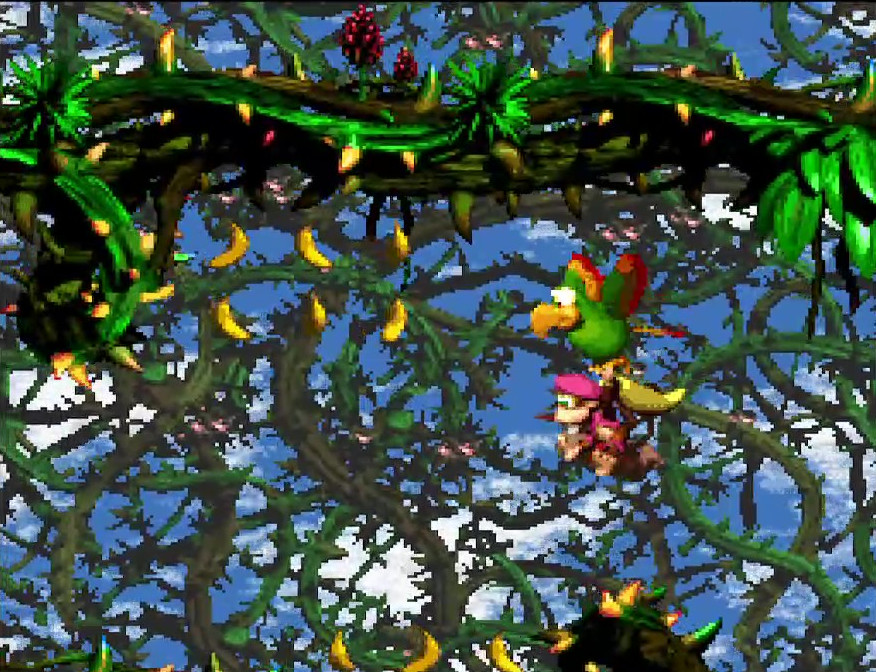
Skip past a climbing section patrolled by Zingers and a Krook, and another jumping section where you need to use running jumps to have any hope of making it between platforms, and you’ll encounter your first Squawks section. First, you ascend upwards, with a few Zingers floating off to the side which you can use as target practice for your egg shot. You’ll need it, too, because the next section is flooded with flying Flitters. Normally, these blue dragonflies are relatively harmless, but in such large swarms, you’ll quickly get overwhelmed if you don’t fire away your egg bullets to take them out. The eggs aren’t fired in a straight line, either, so you have to remember how the egg trajectory is arced and use that to guide your aim. While doing all that, you must also avoid flying into the brambles above and beside you as you move through the area.
Thankfully, while flying with Squawks you can rest on flat stretches of bramble without taking damage. Given how difficult it is to shoot down the Flitter swarm and keep yourself up in the air, this section might be where you learn this ability!
Eventually, you get to the no-Squawks sign and the halfway barrel, where the next climbing section starts. First, you climb upwards into the face of a squadron of waiting Neeks. Almost immediately after you see them, they dive bomb across your path. If you jump, you fall back down to the ground, so you have to shimmy up and down the rope to keep out of their way. At the top of the rope is a junction with a horizontal rope, allowing you to continue onward. Here, however, you encounter a Kannon firing a rapid burst of cannonballs; you cannot pass yet, as the rate of fire is too fast. Instead, you must wait until there is a short pause in fire, then dash across as quickly as you can before the Kannon begins firing anew.
You continue across the path of ropes, and soon you end up on another horizontal rope, square in the path of another Kannon. You don’t see the Kannon on screen, but you can hear him open fire, and soon you’ll see a cannonball flying across the length of rope, straight at you! Luckily, there’s some gaps in the brambles above that give you just enough room to jump up into in order to avoid the shot. You must advance down the rope to the next safe jumping zone, before another cannonball comes screaming across the screen to take you down. Do this a few more times and you’ll finally get close enough to the Kannon to take him out and end the threat for good.
There’s plenty more challenge left in this level, but there’s one more pattern I want to look at. At several junctions throughout this level, you’ll encounter a group of Zingers. Some of them will be red, meaning they are immune to your egg shot, while one or two will be normal yellow Zingers. With all the Zingers alive, the passage through will be near impossible; you need to shoot down the yellow Zingers to clear your path enough to make it through with relative ease. It’s a great way of presenting players with a simple, yet meaningful strategic choice that yields a tangible reward.
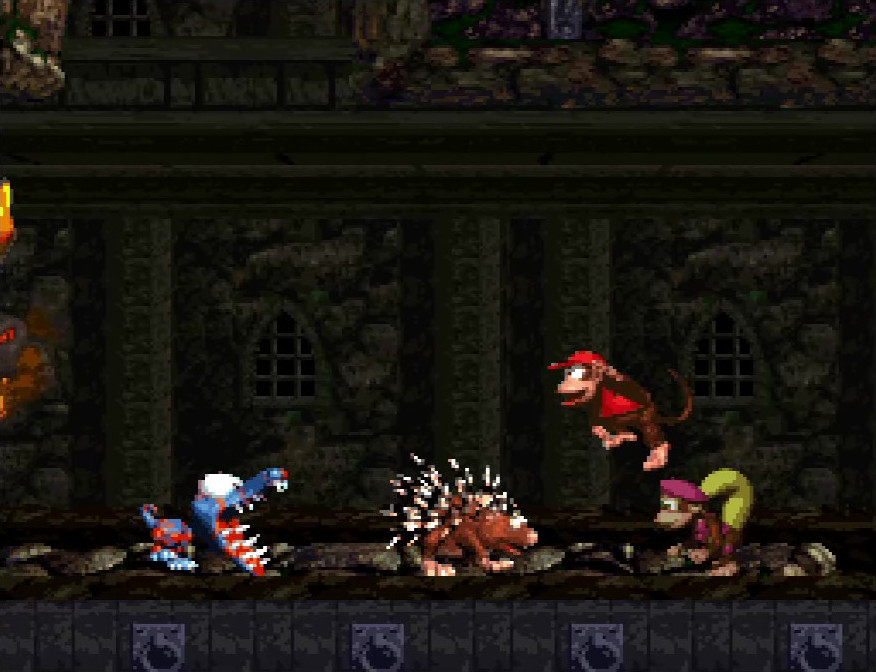
Castle Crush
Our final foray will be into the realm of World 6, Level 3, named Castle Crush. This is another gimmick level. This time, the floor is rising up beneath your feet, and you’ll quickly find yourself running out of head room! To stay alive, you need to keep your eye atop the screen to see where in the ceiling the continuation paths are, and position yourself to be under them before the floor smashes you into the ceiling.
I wasn’t intending for most of these examples to be Level 3s, but that’s how it shook out. 😛
As if that weren’t time pressure enough, the foes populating this level will do their best to come at you from nearly out of nowhere and force you to make quick decisions on how you’re going to handle them. The first enemy you encounter is, once again, a Sneek, dropping down on you from above; a quick and easy enemy to defeat that you’ve, by now, beaten dozens and dozens of times. It also introduces you to a pattern that will be very common in this level: small alcoves containing enemies that drop on you from above.
The next baddie you encounter is a Spiny, also falling down from above. You must defeat him with a spin attack, but you have to time it right; spin too early and you’ll finish the attack animation before the Spiny gets close enough to take damage, resulting in the Spiny landing right on top of you. Some time later in the level, you’ll encounter Klampons dropping in on you from above as well. These you cannot deal with by spin attack, so you must allow them to fall and land, then quickly jump in the air to stomp on them before they close in on you in the tight quarters you keep.
Eventually, shortly before the halfway point, you get introduced to a long hallway that contains both a Spiny and a Klampon. The Spiny is first; if you spin into him, you’ll wind up near where the Klampon patrols, so you’ll have to be careful to ensure you stop your spin in time to get airborne and stomp the Klampon. This section is specifically designed to introduce you to this particular pairing: Spiny and Klampon. It keeps it spaced wide enough that you have a good chance of surviving the encounter while teaching you how difficult it is to deal with both these foes in the same area.
Sure enough, later on in the level, you encounter your first section where a Spiny and a Klampon patrol right next to each other. The Spiny leads, with the Klampon right behind. You now have a difficult choice to make: do you try and leap over the Spiny to jump on the Klampon and defeat him first, or do you instead spin into the Spiny and try to jump right before your spin carries you into the Klampon’s gnashing teeth? Both maneuvers are equally challenging, and with the rising floor you are forced to decide quickly, lest you get squished. It’s one of the most challenging parts of the game, and it feels awesome to correctly execute whichever decision you made.
There are plenty more sections in Castle Crush where the Spiny and Klampon patrol is used. There is even one section where you have alternating Spinies and Klampons dropping on you from above, forcing you to time your attacks so you spin into the dropping Spiny, then quickly jump to stomp on the Klampon before the next Spiny falls onto your lap. All this challenge, and this is only one single part of the many myriad challenges Castle Crush throws your way. By the time you finally ascend to the top of the level and stomp that exit target, you’ll feel exhausted, yet exhilarated at having gotten through.
Kong-clusion
Whew! At last, we’ve made it to the end, not just of Part 3, but this entire series!
In this part, we dove headlong into examining the enemy design and how it was created with the aim of players using their fine-tuned moves on them. The ways each enemy can be defeated provides a framework for understanding what an enemy means in the context of the moves the player can do, from the basic stompable, spinnable baddies to the foes which embody special protections and attacks. Even enemies sharing the same defeat type can have differences in gameplay by exhibiting one or two special behaviors on top of that. Finally, each level in the game, of which we examined several, is tailored to take these enemies and place them in locations that make optimal use of what they do, all in the aim of providing a fun, challenging experience for the player.
Over this entire blog series, I’ve shown why Donkey Kong Country 2’s movement is special. The moves themselves are finely tuned and feel great to perform, and there’s a great many ways to modify the basic movement to provide fun gameplay variety. Every level is designed to take full advantage of these great movement mechanics, rewarding both skillful play and observant exploration. In each level lives enemies that are designed to make using your moves to conquer them, whether by defeating them or avoiding them, fun and exciting.
In short, I think Donkey Kong Country 2’s movement feels amazing. It’s why I loved playing the game as a kid, and it’s why I keep coming back to playing it, nearly thirty years after it was released. Nothing else I’ve played comes close to how this game feels.
As a game designer, it is my hope that I’ll one day get to make a game that pays homage to the movement mechanics of this game. After writing all these blog posts, I’ve certainly squirreled up enough techniques and ideas to take inspiration from!
As a child, I loved to play Donkey Kong Country 2: Diddy’s Kong Quest; as an adult in my early thirties, I still love playing it. One of the reasons, among many, why is the game’s character movement feels almost perfect. Never do I feel as though I can’t adequately control Diddy or Dixie Kong as I navigate them through many levels of perilous adventure. As a game designer, I found myself wondering: what is it, exactly, that makes me love DKC2’s movement so much?
To answer that question, I’ll take a close look at the action verbs DKC2 employs related to the player characters. It’s not just a matter of analyzing the actions and movements in and of themselves, however; the level and enemy design of DKC2 are intentionally crafted to augment those basic and special actions. As is undoubtedly true for many games, it is the whole package together which creates that feel I love so much.
In the previous part, we took a look at the specific actions the Kongs can make, from walking and running to jumping and throwing, as well as the various special forms of movement, like climbing and swimming, and the animal buddies which modify how basic movements work. The actual abilities are only part of the overall story, though; just as critical as how you can move is where you can move. Without level design that compliments the possible actions you can take, a game won’t be as fun as it could be.
Exploration Evaluation
There are 40 regular levels, excluding boss stages. Many challenging sections are included in those levels, often increasing in difficulty as you progress from the early stages to the later ones. While some stages involve special gimmicks, a lot of times the challenge is derived simply from taking the actions you are familiar with and asking you to execute them well to progress. Let’s break down some of the ways this is accomplished.
Basic Navigation
First of all, because the Kongs’ movement is so well-tuned, it’s fun on its own to just move your Kong throughout the level. The short accelerations make the movement feel more smooth while not taking away from your control, like sometimes happens when using long acceleration times. The minimal jump scaling gives you just the right amount of height, and the timing on how much you scale seems perfectly balanced so that you can get the exact jump height you want. The spin move feels fluid and lasts just the right length of time so that you don’t feel like you lose control when you use it. All in all, simply moving through the level is fun.
Beyond moving around, the level structure itself is used to make it easy to figure out where you need to go. In many cases, you are asked to move right (for horizontal levels) or up (for vertical levels). By employing a consistent pattern for where you are expected to move, it makes it hard to get yourself lost in any given level. Some levels are “square”, and in these you start traversing from right to left (or, sometimes, right to left); you eventually reach a vertical section of the level, either up or down, and you then traverse the horizontal plane in the opposite direction from which you came, until you reach the next horizontal section. There are a few cases where this formula is played with, for the sake of variety, but it is never done in a confusing way; you still always know where you should be going.
This is an underrated part of feeling good about your movement; even if it’s fun to move your character around, it’s a lot less fun to not know where you need to go to make progress, and getting lost repeatedly is quite the powerful buzzkill. By making it hard to get lost in any given level, Donkey Kong Country 2 removes a potential source of frustration, and thereby makes everything feel more fun.
Collectibles
Each level also contains sections that have goodies in them, places you are meant to discover and be rewarded for the effort of doing so. Some of these are sprinkled through the course of the main path. Oftentimes, though, these goodie sections are placed in locations that go against the grain of expectations, such as to the left of the level start. A lot of times, these places aren’t particularly hard to reach, and they are intended to reward you for exploring outside of the conventional expectations.
Sometimes, though, collectibles are placed in ways that challenge you to show mastery of your moves. Kong letters are often used in this way, being positioned in such a way that picking them up involves doing some difficult maneuver, like spinning off a platform and jumping at just the right time to both collect the letter and avoid falling to your death.
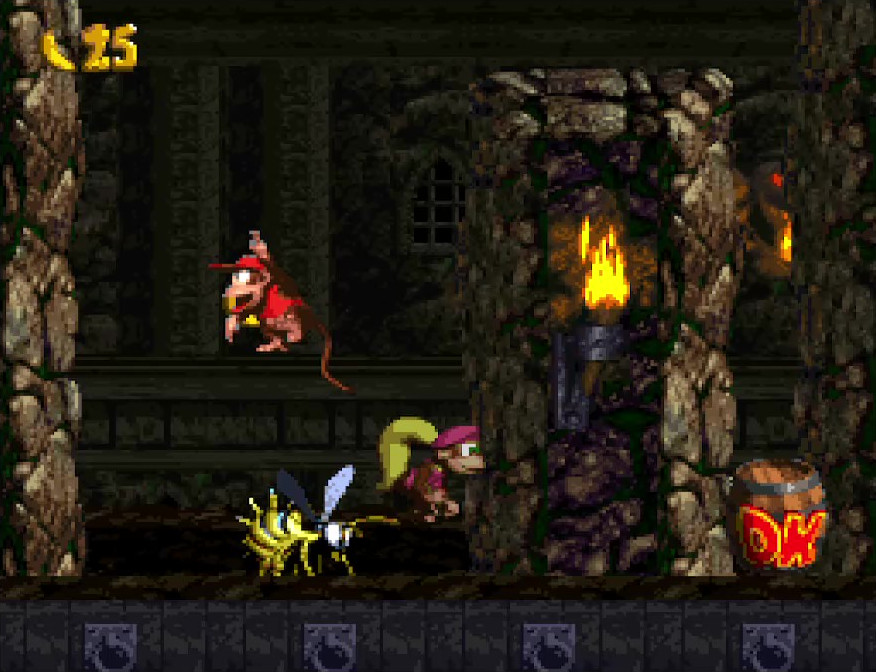
The ultimate collectible is the DK Coin (also known as a Hero Coin). These big, shiny coins, with the letters “DK” embossed on them, are used as an ultimate test of movement, observation, and/or timing. There isn’t a gameplay advantage to collecting them; your reward is the thrill of finding the coin and procuring it through perilous platforming and top-notch timing.
Checkpoint Barrels
Each level in Donkey Kong Country 2 has a single checkpoint barrel, roughly halfway through the level. When a checkpoint barrel is broken, if you die later on in the level you will start the level from this checkpoint barrel’s location instead of the beginning of the level.
How does this tie into movement, precisely? It adds a reprieve from having to play perfectly without dying; if you had to play an entire level without any checkpoints, it would make the game more difficult and tense to play, and thus it would be harder to justify using difficult action sequences later on in the stage. By only having one checkpoint, levels have a clear first-half/second-half dynamic that often allows for introducing level gimmicks and gameplay in the first half, and following them up with more challenging versions of those mechanics in the second half; having more checkpoints would either make individual sections feel too short, and thus not interesting enough, or too difficult, making the whole level feel more like a slog. One checkpoint barrel per level feels like just the right amount, to me.
That analysis on checkpoint segments applies to the 3D Donkey Kong Country games, which use multiple checkpoints per level. It’s one of the reasons I prefer the older games to the modern ones.
Finding Bonus Areas
Each level contains at least one bonus area to find. These bonus areas have entrances that are hidden or obscured in a few different ways. The most obvious ones are bonus barrels, which function like blast barrels that shoot you into the bonus area; while a few are placed in obvious locations, most of these bonus barrels are placed such that they either aren’t visible or are placed in difficult to reach locations, requiring skill to reach. Some bonus areas have entrances which are hidden inside of the level walls, and you need to use a barrel or Rambi’s charge move to break open the entrance.
The final way to enter bonus areas is through Kannons, which require being loaded with cannonballs in order to shoot the Kongs into the bonus area. Whenever you find a cannonball, it always means there’s a Kannon to find in the level, and vice versa, which adds an element of expectation to the gameplay; finding the cannonball first means you need to ensure you keep hauling the cannonball with you until you can reach the Kannon, often requiring agile platforming to avoid dropping it into a chasm; finding the Kannon first means you need to search the level for the corresponding cannonball, and then bring it back to the Kannon.
The ways required to get to bonus areas often involve challenging bits of action use. For instance, a bonus barrel that is too high to jump to means you need to either have both Kongs, so you can team throw into it, or you need to have an animal buddy that can be used to maneuver the required vertical distance (such as Rattly’s jump or Squitter’s platform webs), and consequently that means you need to play well enough to keep your partner or animal buddy around long enough to reach the bonus barrel’s location. Same is true for bonus entrances hidden behind walls; you need to lug a projectile around, or find Rambi and ride him to the bonus area entrance, so that you have something to open the wall with. With projectiles, in particular, that will mean not using them on other baddies along the way, lest you sacrifice your only means of breaking open the wall. Such gameplay subtly adds difficulty in executing moves you are already familiar with, rewarding partaking in these optional challenges with the right to enter a bonus area.
Bonus areas themselves often have gameplay that challenges your mastery of the game’s movement mechanics, but since these are the same as what you encounter in normal level gameplay, just harder, I won’t go into detail on them.
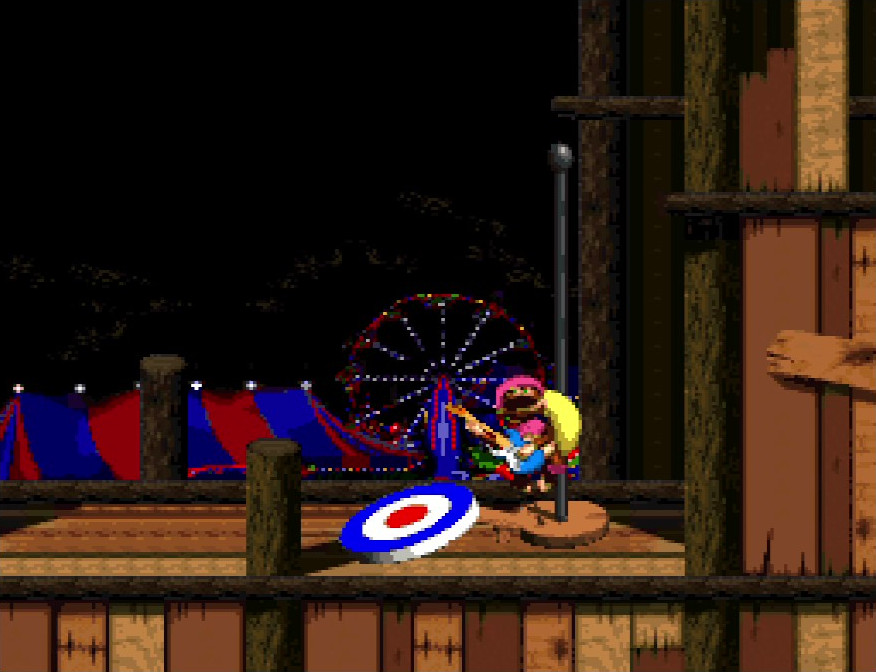
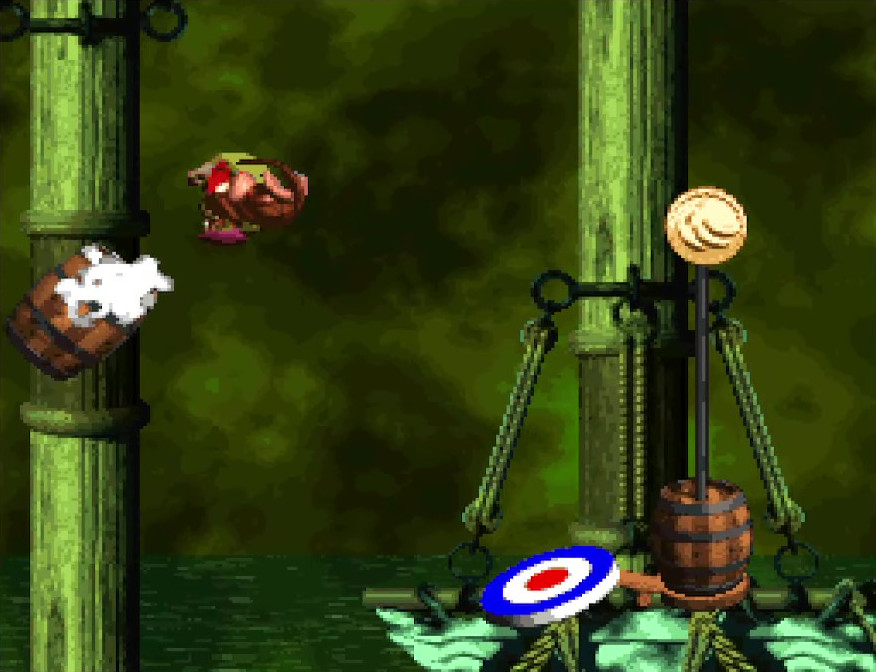
End Level Targets
To wrap up our look into Donkey Kong Country 2’s level navigation, let’s investigate the end-of-level mechanic that is used. It consists of a target and pole, akin to hammer games you might see at a fair or carnival. The mechanics of how it works matches those counterparts as well: if you hit the target with enough force, you cause the barrel on the pole to shoot up and knock down the reward on the top; otherwise, it simply gives a lackluster bump as the Kongs scamper off stage. What reward you get is randomized between 3-4 options of differing value, from single bananas to banana coins to extra life balloons (and, in a few cases, Kong letters or Hero Coins).
Simply jumping from ground level onto the target isn’t enough to claim the reward; you need to find a height tall enough to jump from, or you need to find a blast barrel that will shoot you into the target. While it’s usually pretty obvious where you’ll need to go to get the necessary force to break the target, it’s still a small test of observational skills nonetheless.
Most of the challenge of these end-level targets, however, comes from timing your jump or blast to coincide with when the reward you want to claim appears. The cycle time is relatively short, so usually waiting to launch at the target until your desired reward is displayed results in not hitting the target until the next reward has been cycled in. Thus, you need to pay attention to the pattern to figure out when the reward you want appears in the cycle of items, and then launch shortly after the prior reward appears, ensuring that you’ll arrive on target at the correct moment.
There’s usually no threat of death during these sections, so it’s merely a matter of finding the right place to launch from, and then timing it right to get the reward you intend. It’s a simple little challenge, adding a less tense form of skillful challenge to wrap up the more difficult sections of level preceding it.
Platforming Perils
There’s more to Donkey Kong 2’s level design than just navigating the levels. Often, you the player are given challenging sequences to get past as part of level progression, using both the regular movements given to you and special movement mechanics. The degree of challenge expected from each varies, generally starting with simple asks in the first worlds, to downright difficult sequences in the final worlds. Let’s examine the various ways the game presents these challenges to you.
Level Architecture
Oftentimes, the challenges are introduced through the level’s architecture. A frequent case is the use of gaps between platforms, where you must often use running jumps or spin jumps to get enough speed to clear the gaps. The ground heights themselves are varied throughout an individual level, and those too can be used to introduce challenge, such as having to time your jump onto a higher or lower platform while avoiding a baddie shooting projectiles across that plane.
Speaking of enemy placements, those too are used to introduce platforming challenges. For instance, you’ll be asked sometimes to navigate a huge platform gap by jumping on the backs of flying enemies; failure to do this successfully results in falling downward, often to your death. Even when it isn’t required as part of level progression, jumping off of enemies is also used as a means to access goodie areas or bonus entrances.
The responsiveness and control make it feel as though you can easily pull off whatever moves you need to; there are rarely any sections that are so maddeningly precise that you have to spend an hour or more just to execute the moves needed. That doesn’t mean the challenging sections of the game are easy to pull off; you still need to be precise with your button presses. Rarely, however, will you find yourself stuck on a level section because the actions needed to get past it are borderline impossible.
There are a few exceptions. Looking at you, Animal Antics!
Climbing Sections
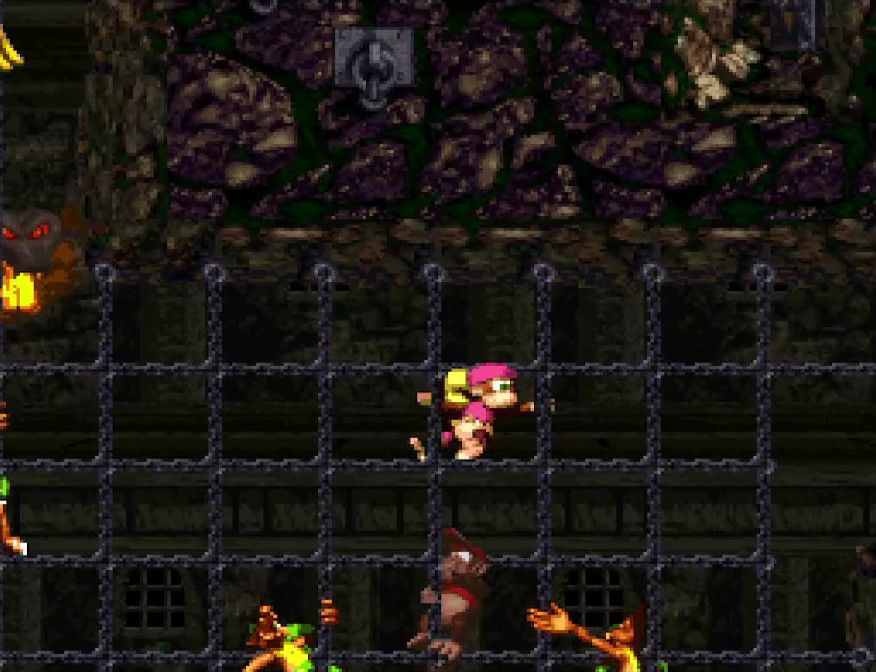
Ropes restrict your movement to specific planes, and enemies are placed along the ropes to force you to jump across with good timing to get past them. Taking away some of your freedom of movement makes it clear what you need to do to move on. Sometimes, you encounter “rope net” sections which give you climbing ability across both vertical and horizontal planes, at the expense of reduced horizontal climbing speed; these are a great mechanic to take the rope climbing experience and introduce a different flavor of it.
Another climbing mechanic is the use of hooks. These objects hold your Kong in place when you jump into them, until you jump away from them. Unlike ropes, hooks are all about asking you to move aerially, and oftentimes multiple hooks are placed in succession, requiring you to jump from hook to hook to continue onward. It’s a bit of a combination between jump movement and rope movement.
Blast Barrel Sections
Blast barrels, unlike their projectile counterparts, are not thrown. Instead, you jump into one of these barrels, and while in the barrel your normal movement is taken away. By “firing” the blast barrel (by tapping the jump button), you are launched out of the barrel’s open top, regaining air movement shortly afterwards. With your normal movement taken away, you instead need to rely on aiming the barrels in the correct direction before blasting out.
There are many kinds of blast barrel to play with throughout the game. Some let you rotate the barrel by pressing the directional buttons. Some spin automatically, requiring you to time your blast right when the barrel is facing the direction you want to go. Some don’t rotate at all; these are often aimed straight up, and are meant for you to use your aerial control after being fired to get where you need to go. Alternatively, they can be aimed in a fixed direction, with baddies between you and the next section, again making it a matter of timing to blast yourself out when the enemy is not in the line of fire. Occasionally, you’ll encounter automatic blast barrels, that shoot almost as soon as you jump into them; these are most often used to take you through a predetermined sequence of barrels, or to get you out of one level area to the next one.
There are a few levels which introduce special blast barrel mechanics. Timed barrels are regular blast barrels that automatically fire after an on-barrel timer expires, giving you a short amount of time to align the barrel correctly before getting shot into an enemy or abyss. Tracker barrels, instead of rotating the barrel, instead let you move the barrel itself across the level, and you’ll need to use them to get across dangerous sections of the level before blasting out. Kong Blast Barrels, marked with Diddy or Dixie heads, will only operate if the Kong you currently control matches the head shown on the barrel, requiring you to keep that Kong alive in order to use them.
Why use blast barrels at all, when you have normal movements that feel great to use? An obvious answer is to provide another change of pace to level mechanics, which in general helps with preventing things from getting too stale. Also, since barrels fire the Kongs at high velocities, it adds a speed thrill to the game while controlling it enough to not make it maddening; if this fast speed was your default movement speed, it would be very hard to control what you were doing. Finally, it provides a new way to take skills you’ve needed to use through normal movement (such as timing moves to defeat or avoid enemies) and gives you a new context to use them in. These things combine to make blast barrels interesting and fun, good qualities to add to any game!
Animal Buddy Sections
Some levels give you access to an animal buddy, and while you have the animal buddy you have to use its different movement to get through the level. Oftentimes, the level is designed with this in mind. For example, when having Rattly, the levels subsequently are designed with vertical traversal and jumping as central components for sections of that level. You usually don’t need to use the animal buddy for the entire level, however, and signposts with “no animal” signs tell you at what point the animal buddy will be taken away from you; crossing this signpost causes the animal buddy to disappear in a poof of clouds, along with some reward for keeping the animal buddy up to that point in the level.
Not all levels with animal buddies require you to use them to get through the level. Sometimes, the animal buddies are hidden somewhere in the level, and usually not in obvious places. In cases like these, you can beat the level without them, although doing so is usually more difficult; having the buddy makes the level easier to beat, but places a challenge on locating the animal buddy in the first place. This encourages you to search around to see if there are hidden or obscured level sections that would lead you to finding an animal buddy. This reveals another function of the no-animal signposts: if you see one for a particular animal buddy that you don’t currently have, that’s a sign that one was hidden somewhere in the level for you to find.
Some levels do require the animal buddy to proceed. Most of the time, in these cases, you’ll jump into a special Animal Barrel that transforms the Kongs into the animal buddy pictured on the side. The levels which do this are subsequently designed with far more challenging sections that can only be defeated through good use of that animal buddy’s movements and skills. By forcing you to become the animal buddy, you’re prevented from getting yourself in a position where you lose the animal buddy in a level section that requires their movements to get past. It’s a great way of employing user experience to enhance the level design.
Level Gimmicks
Some levels have their own special mechanics that you have to deal with. For example, in one level, the level is filled with lava, until you jump on Clapper the Seal, who temporarily transforms that lava into water which can be safely traversed. Another level has a wind mechanic, where every so often the wind blows strongly enough to affect all Kong movement, forcing you to have to plan your jumps when the wind is blowing in the direction you want to move. Yet another level features a rising floor, forcing you to make quick decisions about where to go and how to defeat enemies, before running out of room and getting crushed. Most of the time, such gimmicks are only used in that specific level.
How do these gimmicks impact movement? It’s a clever way to test your knowledge and mastery of the various movement mechanics you’ve been introduced to. By adding a special mechanic that changes normal level gameplay, you need to understand how these gimmicks impact your abilities. In cases where your movement itself is directly affected by the gimmick, you also need to apply that understanding to counteract the gimmick’s impact to continue making progress through the level.
Beyond mechanics, special level gimmicks help those levels feel more memorable!
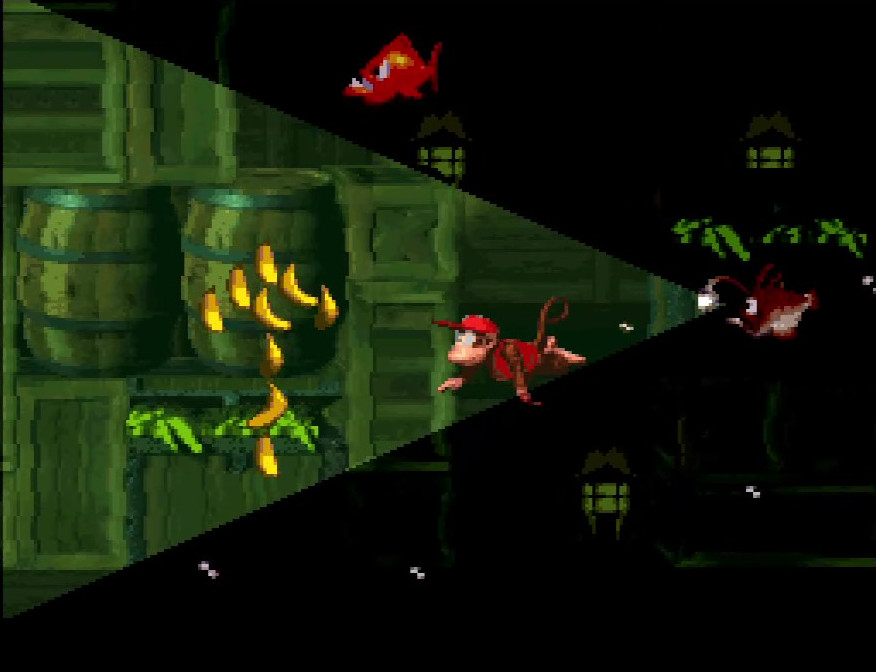
Camera Concoctions
A critical, yet often overlooked, aspect of movement is the game’s camera. After all, it’s a lot harder to make precise movements if the camera isn’t framing the action well! Thankfully, Donkey Kong Country 2’s camera is well designed to enable making your movements with confidence that you won’t get screwed over by it. It’s also used as a way to focus your attention on where you need to be going, as well as hiding goodie sections and bonus areas.
Framing
Let’s start with looking at the basic camera framing. When moving through a horizontal stage, the camera is placed mostly behind you, leaving you a little sight of what’s happening behind you, but giving most of its real estate on the challenges that are immediately in front of you, the direction you need to be going. If you turn around and move leftwards in a horizontal level, however, the camera position shifts to put the Kongs at the center, giving you more sight into what’s happening behind you, without making it feel like this is the “correct” direction to be moving in. It’s one way the game helps prevent you from getting lost in a level.
What about vertical or square levels, where progression can include moving leftwards or rightwards? Here, the camera sits in such a way that you can see more of the area in the direction the Kongs are facing than the direction behind them. This is a good compromise, though it does sacrifice some of the camera’s ability to tell the player where to go. Such instances are usually paired with level design that doesn’t let you move too far in a horizontal direction, however, so if you do end up accidentally backtracking, you won’t lose much time over it before figuring it out and turning to go the correct way.
A technique that is also used is placing sections of level that are impossible to navigate backwards through once you go through them. There are also a few instances where the camera itself is prevented from moving backwards, forcing you to keep moving in the intended level direction.
Motion
Something that isn’t immediately obvious, until you start paying attention to it, is that the camera’s vertical height is precisely controlled. Depending on where you are in the level, the camera’s vertical height is fixed at a predetermined coordinate; as you move through the stage horizontally, the camera’s height is automatically adjusted depending on the height of the terrain you are walking across. When you reach vertical level sections, or swimming and flying areas that involve vertical movement, then the camera follows the player’s movement.
There are certain areas of a level where the camera’s vertical and horizontal movement are stopped. In cases like these, it makes it clear where the intended progress of a level is, and it also prevents the camera from clipping too far off the edge of a level (a place you don’t need to see to make any gameplay decisions). Interestingly, this technique is sometimes used to obscure entrances to goodie or bonus areas, requiring you to watch carefully for telltales signs (such as the lone banana near the edge of the screen) and rewarding you for your observational skills.
Importantly, the camera does not move vertically to follow Diddy and Dixie when they jump. This allows you to not lose sight of the ground, and anything on it you might be jumping towards or away from. It is a subtle way of allowing you to maintain precise control over where you are moving. If this camera mechanic weren’t in place, it’d be easy for enemies to drop out of frame while you’re in mid-air. That would make it much harder to plot your movements, since you’d have to rely on memory to know where you should and shouldn’t jump. It’s a crucial component to making the Kongs’ movements feel good.
Aspect Ratio
A huge difference with Donkey Kong Country 2, compared to modern platformers, is the use of the squarish 4:3 aspect ratio. This was how most TVs were built back in the days when this game was released, so that was the only supported resolution the game had. Unlike the rectangular 16:9 aspect ratio, which is what computer monitors and TVs commonly use these days, 4:3 gives you much less horizontal screen real estate, so there’s less room to tell you what’s coming up.
Having to account for this limited width of frame has a lot of influence on the game’s design. For example, rarely do you see long and wide sections of challenging gameplay, and the times you do encounter them are specifically designed with the obscured view in mind, forcing you to react quickly to what you see as the camera reveals what’s coming next; consequently, you need to know your movement well so you don’t have to think about what to do when you see the next challenge in frame; you can just instinctively react to it. We don’t often think of aspect ratio as a part of the game designer’s arsenal, but the limited nature of the aspect ratio in DKC2 is clear evidence that it does, in fact, play an important part of how a game’s design feels.
To Be Kong-tinued
In this part, we examined many different ways the level design of Donkey Kong Country 2 takes the movement mechanics of the player and provides exciting, challenging ways to use them. We also examined the various special forms of gameplay, which either incorporate special movements or enhance the challenge of your regular movements. Finally, we took a look at how the game’s camera itself plays an important role in how the movement feels. No matter how good a game’s character feels to move, without good level design those good movements won’t feel as fun as they could be.
There is one more component that makes the movement feel good: the enemy design. In the final part of this three-part series, we’ll examine the baddies of Donkey Kong Country 2 and how they, too, play a crucial role in making the movement feel good. Stay tuned!
This is Part 2 of a 3-part series. Check out all the parts here!
As a child, I loved to play Donkey Kong Country 2: Diddy’s Kong Quest; as an adult in my early thirties, I still love playing it. One of the reasons, among many, why is the game’s character movement feels almost perfect. Never do I feel as though I can’t adequately control Diddy or Dixie Kong as I navigate them through many levels of perilous adventure. As a game designer, I found myself wondering: what is it, exactly, that makes me love DKC2’s movement so much?
To begin answering that question, I’ll take a close look at the action verbs DKC2 employs related to the player characters. It’s not just a matter of analyzing the actions and movements in and of themselves, however; the level and enemy design of DKC2 are intentionally crafted to augment those basic actions. As is undoubtedly true for many games, it is the whole package together which creates that feel I love so much.
To break this lengthy dissertation into digestible chunks, this will be a three-part series. We’ll open up with a look at the basic movements and abilities of the Kongs themselves, as well as some special moves that are used to spice up the normal gameplay. After that, we’ll examine how the levels are designed to take advantage of the basic and special moves. Finally, we’ll look at the enemy designs and how those compliment the basic moves and abilities as well.
Kong Kapabilities
To begin this design dissection, we’ll look at the many forms of movement present for the Kongs in DKC2. First up: the core action verbs. Each Kong possess a base set of moves that you’ll be employing throughout the majority of the game.
Walk and Run
You have two basic ground movements, one for walking, and one for running. Diddy’s speed is slightly faster than Dixie’s, for both walking and running, but both feel fast enough that I don’t feel particularly disadvantaged when using the slower Kong. The actual movement speeds themselves feel just right to me; I’ve never found myself wishing that I could move faster or slower.
Triggering the run and walk actions are simple: hold the Y button and a direction to run in said direction; don’t hold Y, and that same directional input is a walk. Personally, I always appreciate it when games give me the ability to walk when I want to, even if most of the time I’m probably going to run. Having an easy-to-use slow option gives me that more precise control when I feel like I need it.
For 3D games, having easy walking also lets me get more immersed in the fantasy of inhabiting a character in a world. No one runs all the time in real life!
Accelerating from a standstill to a walk is near-instantaneous, which further helps with making the Kongs easy to control, but there is just enough acceleration that you don’t feel the characters instantly transition from idle to walk. Running, on the other hand, only happens after you press the Y button, which triggers the controlled Kong’s spin move before transitioning to the run. That animation helps convey a reason for why the character is suddenly transitioning to a run speed, while also giving you an attack move which is easy to trigger. If you were holding Y and start moving from idle, though, you just accelerate briefly into the run speed; again, just enough acceleration to make it not instantaneous, but short enough that it doesn’t impact your control over the character.
Speaking of spin maneuvers…
Spin
Both Kongs have a spinning maneuver, but each does it differently. The execution of both spin maneuvers result in the same outcome, however: pressing the Y button causes the Kong to perform a spinning attack move, which is capable of defeating most ground enemies; if Y is still held, then any directional ground movement will subsequently result in the Kong moving at a running speed.
As mentioned, the Kongs each have their own spin on the spin maneuver. Diddy’s is a cartwheel, looking quite acrobatic, while Dixie’s is a body spin, twirling her pony tail (termed by the game as a “helicopter spin”). Interestingly, Diddy’s cartwheel looks like a more natural action than Dixie’s, which can contribute to his move feeling faster than Dixies, but in fact both spin at the same speed and move the same distance, which means you aren’t disadvantaged when faced with level sections which ask you to use the maneuver.
Dixie’s helicopter spin serves a second purpose while in air: pressing Y while in midair causes Dixie to spin constantly, giving her a slower fall speed, and thereby giving the player greater control over where they want to land. Diddy does not have this ability, which helps give both Kongs distinct roles: Dixie is useful for air control, while Diddy is useful for moving more quickly.
Jump
An essential ingredient to most 2D platformers is the jumping action, and both Diddy and Dixie are more than capable of performing this function. Pressing the B button causes the selected Kong to jump into the air, up to approximately three times their own height. Tapping B causes a short jump, while holding B slightly longer results in a higher jump. While it may seem pointless to have this scaled jumping, having some control over your jump height makes you feel more in control than you would if you only had a single jump height.
There is more to the feel of the jump than the upward movement. Running and jumping allows you to cover more horizontal distance than walking and jumping, providing more encouragement to run through the levels. While in the air, you have full control over horizontal direction, giving you the ability to precisely place where you want to land and making air control feel responsive. When you fall, you accelerate to a constant speed, which you maintain until you hit the ground (or the enemy on it), which makes it easier to predict where your jumps will land.
Interestingly, it seems that your fall speed is the same as your jump speed; it takes the same amount of time to fall from the apex of your jump as it does to jump up to it. However, if you are moving in a horizontal direction while in midair, it seems to slightly increase the amount of time the Kong stays at the apex of the jump. This is something I only noticed when going through my recorded footage frame-by-frame to try and get ballpark estimates, but now that I think about it, this gives you a little more time to figure out where you want to land before you start falling. It’s a clever design, one that I hadn’t thought about before.
Most enemies can be defeated by jumping on them, and this jump attack is something you’re going to do a lot throughout the course of the game. The game encourages you to do this by giving you a greater jump height when you jump off the top of an enemy than when you jump from the ground, allowing you to cover greater distances. Even if you don’t actually jump off the enemy, landing on one grants you a small bounce acceleration that still lets you move up and onward. These movements help make bouncing off an enemy feel good.
The spin moves also have a role to play in performing jumps. While spinning off of a ledge, you can press the jump button (B) to cause the Kong to jump while in mid-air. This allows the Kong to cover more horizontal distance than they’d be able to cover by simply running and jumping. The timing on this is fairly forgiving; the game doesn’t want to impede you from pulling this maneuver off.
Duck
It’s easy to forget about the ability to duck, as it’s a passive move compared to walking, running, spinning and jumping. This move causes your Kong to duck down and hold still, effectively decreasing their vertical hitbox size by about half. This is used to less effect than other moves, but there are still places that will require you to duck under passing enemies, so it has a part to play in the movement design.
Team Throw
Finally, you can pick up your partner to put them on your Kong’s shoulders, then subsequently throw them by pressing Y (the normal throw button). If you hold the up direction as you throw, this results in launching your partner up into the air in a slow, controllable way; without this, your partner Kong is simply thrown to the ground, remaining where they fell until you come back for them (or they go off-screen, in which case they run back to you automatically). The horizontal throw can also be used to defeat enemies that could be defeated with normal attacks.
Special Skills
Now that we’ve discussed the basic Kong moveset, let’s examine cases where the game modifies these default maneuvers to introduce other forms of gameplay. These serve as an occasional change-up to how the game flows. Just as with basic movement, the feel of these special movements is important.
Climbing
Throughout various levels, ropes are placed, which the Kongs can climb when you leap into them. While on a rope, your movement is restricted to a single plane, either horizontal or vertical (depending on which way the rope faces). Diddy and Dixie’s different movement speeds factor here as well, with Diddy being able to traverse ropes slightly faster than Dixie.
Keeping the rope climbing speeds fast, close to their walking speeds, means that it doesn’t feel like the game slows down during the climbing sections, so they still feel good to move around on. This, in turn, makes it fun to navigate through the various challenges the designers place along the paths the ropes and chains force you to traverse.
Swimming
In some levels, there are water sections that the Kongs can swim in. Jump and spin attacks can’t be performed underwater, so the gameplay changes from defeating enemies to avoiding them. While underwater, you are able to move in all directions, but you sink downward unless you tap the B (jump) button to swim upward.
Like the climbing sections, your movement speed underwater is close to your regular movement speed, although the requirement of tapping the B button makes swimming more skillful than simple navigation; you have to time button presses to keep yourself afloat while swimming past enemies. Unlike the climbing sections, swimming sections allow you unrestricted horizontal and vertical movement, adding yet another flavor of movement variety to break up the rote platforming that dominates most of the game.
Flying
Some levels give you access to the Squawks animal buddy, a parrot that grants the Kongs the ability to fly. The flying sections are similar to swimming sections; you can move in all directions, but have to continuously tap B to move up or you float back down to the ground.
The similarity in how swimming and flying sections work from a movement standpoint allows for the designers to reuse player expectations for how those mechanics work, and avoid having to teach yet another new mechanic.
Speaking of animal buddies…
Animal Buddies
These are animals that the Kongs can ride (or, in some cases, transform into), and using an animal buddy changes what moves the player can perform. With all the animal buddies, there are similar base movement motions: there is a slower “normal” speed, and then a faster “running/swimming/flying” speed when moving while holding down Y. Beyond that, however, each animal introduces different changes to the movement equation.
Animals can be accessed in two ways. One is through a crate, in which case the Kongs ride the animal. While riding the animal, taking damage causes the Kong to fall off and the animal to run away; you can also choose to dismount the animal willingly. The other is by transforming into the animal itself. Dismounting the animal is no longer an option, so you are stuck with that animal’s movement changes. Usually, transformed mode is given when the level’s design explicitly requires that particular animal’s movements to progress through the level.
Either way, at some point in the level you’ll reach a “no-animal” sign, which removes the animal buddy and gives you some kind of reward. By giving an end to the animal buddy use, this allows for only having some parts of the level be designed around the use of the animal, and in some cases even have multiple animals within the same level. It makes the animal buddies another tool in the player’s movement arsenal.
Let’s take a look at the animals and what their movements add to the gameplay.
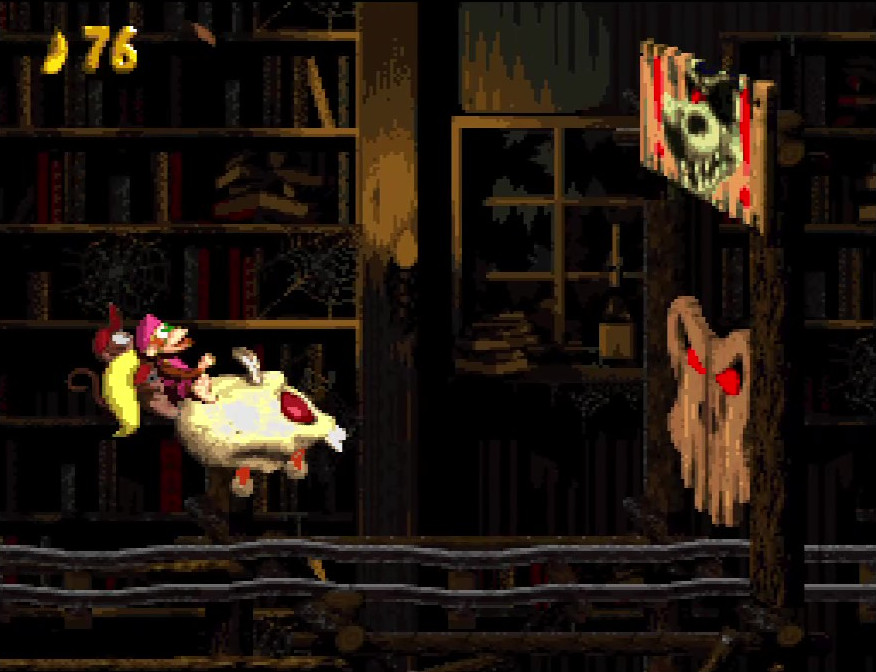
Rambi
A rhinocerous that gives you a faster running speed. Rambi is impervious to damage when jumping on enemies or running into them with its horn, only being vulnerable to attacks from behind (and certain projectiles). Holding down A prepares an even faster run in the direction Rambi is facing, plowing through enemies and breaking through hidden entrances to bonus areas.
Riding Rambi makes you feel almost invincible, so you feel more willing to move fast and make risky decisions. Enemies are mostly no longer a challenge for you. These things combined make Rambi feel amazing to use. To account for this, oftentimes Rambi’s location in a level is hidden, making finding him a reward for looking around the levels, rather than blazing through them.
Enguarde
A swordfish that gives you full movement control underwater. No longer do you need to tap B to stay afloat; Enguarde hovers in place when idle, and moves in whatever direction you input. The sharp-looking bill on its face can defeat any underwater enemy, and clearing enemies makes the underwater sections that much easier.
Having Enguarde removes a lot of the challenge from swimming movement, which means riding Enguarde feels similar to riding Rambi, in that you feel more free to move where you please, with ease. Since Enguarde makes underwater movement and gameplay much easier, his locations, like Rambi’s, are hidden well in the level, so that finding and using him is a reward for good exploration.
One could think of Enguarde as the underwater version of Rambi.
Squawks
As mentioned, Squawks is a parrot that gives you the ability to fly in a stage. Unlike Enguarde, you don’t get to hover in place when idle, so there is still challenge involved with using the bird. Squawks also has a ranged attack, hurling eggs out of its mouth in a parabolic trajectory when the Y button is pressed.
Unlike Enguarde, who generally makes level movement easier, Squawks requires more care to ride. Any contact with an enemy damages Squawks, so you are required to be careful as to where you fly. The egg projectiles don’t fly straight, so aiming them to hit enemies, while maintaining flight, is in and of itself a challenge for the player. As such, Squawks is often placed in locations that are easier for the player to find.
Squitter
Squitter gives you the ability to shoot webs. Pressing Y delivers an attack web which can defeat any non-invulnerable enemy; you can control the arc of the shot by holding up or down on the direction input after the attack web has been fired. Pressing the A button (or, alternatively, either the L or R buttons) shoots a slow-moving platform web. Pressing the platform web button again after firing deploys the web platform, giving you something to stand on in mid-air. These platforms disappear after a short period of time, however, so you need to move quickly. Unlike other ground animals, Squitter cannot defeat enemies by jumping on them, so you need to keep away from foes and blast them from afar.
From a design standpoint, Squitter is a massive change to your movement toolset. Riding him takes away your ability to jump on enemies, but gives you an infinite amount of projectiles, making you adopt a long-ranged approach to defeating enemies. Creating platforms at will allows you to avoid hazards, pitfalls, and enemies that would otherwise prove difficult or impossible to overcome; they also provide an interesting way to add more vertical movement to the regular platforming action.
Rattly
This snake has an extremely high jump, allowing you to reach higher platforms than you could with the Kongs by themselves. Holding down A charges Rattly to make a super-jump, similar to how holding A charges Rambi to make a super run. Rattly defeats any enemy that it jumps on, except for ones that are invincible. Interestingly, when Rattly moves along the ground, movement consists of small jumps that result in a lurching style of movement; this is perhaps an encouragement to move by pressing the jump button, which feels more fun to do.
Rattly is all about the jump. He can jump on nearly anything and live, and, since your spin attack is taken away while riding him, you are strongly encouraged to jump on foes in your path. The high jump allows for adding taller sections to levels that take advantage of that bigger jump height.
I am leaving out Glimmer and Clapper because they do not change your movement mechanics.
Careening in Carts
Three levels let you ride in carts. While in a cart, the Kongs move in a consistent rightward direction at a controlled speed (you can go faster by holding the forward directional input, and slower by holding back). Depending on the level, jumping will either cause both Kong and cart to jump, or just the Kong. With the consistent movement, beating these levels is about reacting to upcoming threats quickly; you aren’t given time to ponder your next action. This can be frustrating while learning the level, but it results in satisfying rushes once you consistently react correctly to the level’s challenges.
What does this sudden change in movement bring to the design table? The rush of speed, for one. It’s fun to move fast through a level, much faster than you normally get to move. Along with that speed comes reduced amounts of time to react to level hazards. You can’t stop to figure out how to get past those hazards, either; you’re hurtling at them at high velocity, and you have to make quick choices about how to get past them. This is hard, but exhilarating, and they add a health dash of experiential spice to the movement gameplay.
These cart levels are ones I loved playing as a kid. That said, I think it’s good that there aren’t many of these kind of levels, as the high tension throughout would make level to level gameplay far more exhausting if that was the majority of the action.
Tossing in Throwable Objects
One final Kong ability remains: throwing objects. Both Kongs are capable of picking up and holding barrels and other objects placed throughout the level by holding the Y button; releasing the Y button causes the Kong to throw the projectile, which will defeat any enemy that it touches along the flight path. Aside from certain animal buddies, this is the only ranged attack you have access to in the game.
In many cases, the objects will break on impact, whether with the world or an enemy, making them a single-use resource. This forces you to consider carefully when you encounter a projectile to throw; should you use it now, on the nearest enemy, or should you try to hold on to it to use on some future part of the level with a more difficult obstacle, or a bonus area entrance? Your movement isn’t impeded while holding a barrel, so you still have the same level of control that you do normally; however, since objects break on contact, and you are forced to throw the object when you jump on an enemy, holding on to a projectile you wish to keep intact transforms the gameplay from defeating enemies to avoiding them until such time as you wish to use the projectile. This is a great way to subtly introduce a change in gameplay.
Interestingly, I always thought in my mind that you moved slowly while holding on to a barrel, but in testing I found that this is actually not true; you still move the same amount regardless of whether you’re holding an object or not. This is an interesting psychological effect; I wonder if the designers intended it, or if it was just a byproduct of our expectations for movement with held objects.
What if you don’t want to hold the projectile right now, but still need to keep it around? You can hold down and release Y to set the object back down on the ground, where it will wait for you to collect again. If you move far enough to cause the object to go off-screen, however, it resets its position back to where you found it; while this was probably something introduced by the technological limitations of the SNES days, rather than a design decision, it’s something you still have to consider when setting the object down.
The way in which Diddy and Dixie throw projectiles differs for each. Diddy picks up objects with his hands and throws them in a flat, shallow arc that is almost effectively a straight line; Dixie picks up objects with her ponytail (boy, her hair can really defy the laws of physics, can’t it) and throws them with a more pronounced arc. Because her hair is on her head, the release point of projectiles Dixie throws is higher than Diddy’s, resulting in making it easier to hit enemies that are up in the air. Both Kongs are able to jump while holding objects, which provides additional control over where the projectile is thrown. Since Diddy’s throw starts lower to the ground, jumping and throwing is almost essential when throwing with him to get good distance. Giving the two Kongs different throwing styles further differentiates between using the two Kongs, making it useful to have both around to switch up which one you use for a given situation.
There are many kinds of objects the Kongs can throw throughout their journey. Each kind of object provides different characteristics that affect player strategy for using them.
Barrels
This is the bread and butter projectile of the game: a simple, metal-banded wooden barrel. You can throw it normally, which will fling the barrel forward and cause it to break on impact with the ground (plowing through however many enemies were in its way), or you can heave it upwards into the air, which will cause it to land softly enough to not break on impact, and subsequently will roll along the ground (and through enemies) until it hits a wall or falls off a ledge.
Crates
Crates, on the other hand, are square projectiles that clearly communicate that they won’t roll. They also break on impact, regardless of how you throw them, making them a much more limited resource.
Buddy Barrel
The buddy barrel contains your partner Kong, if you lost them at some point during gameplay, and when the barrel breaks open you get your partner back. Interestingly, the buddy barrel’s impact mechanics are similar to the crate, in that it breaks immediately on impact with the ground or with an enemy, so when there is no Kong in the barrel the two objects are pretty much the same, functionally.
Cannonballs
These spheres of solid metal do not break on impact with anything, but they also do not roll when they hit the ground. Because of their indestructible nature, they are useful as reusable projectiles or shields for as long as you can keep from throwing them into a pit.
Chests
Chests break only on impact with enemies (or bonus area entrances), and they contain some form of beneficial pickup (or “goodies”) which gives you something of value, from banana bunches to life balloons (extra lives) to Kong letters, and everything in between. Since they don’t break on hitting the ground, you pretty much have to use them on enemies, which means you’ll have to find an enemy to use it on or you won’t be able to break it.
TNT Barrels
The holy hand grenade of DKC2, these explosive barrels are capable of destroying any enemy in a fiery explosion. This explosion has a small radius that will destroy any other enemies it touches. This barrel is often the only means you are given to deal with invulnerable enemies, which means being given one can be a sign that such an enemy is coming up.
To Be Kong-tinued
We’ve taken a deep look into the movement of Donkey Kong Country 2. From the simplest, basic moves to the variations introduced by special abilities, controlling the Kongs feels tight, responsive, and fun. But having characters that move well is only part of the gameplay story; the environments the Kongs move through and the enemies they fight contribute just as much to the feel of the movement as the movement itself.
In the next part of this series, we’ll take a dive into the level design of Donkey Kong Country 2, and see how much it impacts how the movement feels. Stay tuned!
This is Part 1 of a 3-part series. Check out all the parts here!
Learning how to use a bullet journal has been one of the most important things to happen in my life.
Yes, I’m comparing the use of a paper book intended for organization up there with events such as my marriage or the birth of my son, and no, I’m not trivializing either of those things by comparison.
Let me put it this way: bullet journaling has almost single-handedly given me, someone with severe ADHD, the capability to structure my life in such a way that I can attempt to accomplish my dreams. If I hadn’t learned how to do it, I would undoubtedly not be in the blessed, fortunate position that I am in today, supporting my family with web development and making games on the side.
I know there’s plenty of resources out there that talk about bullet journaling; my intent here is merely to tell my own story: how my life was prior to bullet journaling, how I implemented bullet journaling techniques, and how I use bullet journaling today. In doing so, perhaps you may be convinced to try bullet journaling yourself; or, if you already use a bullet journal, you might see techniques you can take to augment your own journaling methods.
Shoutout to Todd Mitchell of Code Write Play, whose inquiries about my bullet journaling experience led directly to me writing this article!
Life Before Bullet Journaling
As mentioned, I have ADHD (Attention Deficit Hyperactivity Disorder). This malady is caused by a deficit of chemicals in my brain which help it to focus and make judgment calls, functionalities that are critical if one wants to have any measure of success in life. Because I struggle with these things, my life is made exceptionally more difficult. While medication significantly helps with regulating the chemical levels in my brain, it doesn’t magically grant me the ability to focus perfectly and make good decisions; I need to supplement the medications with good habits and routines. Ironically, forming good habits and routines are things which require focus and sound judgment.
How do “normal” people form good habits and routines, beyond “just doing it” (an ability that is not readily available to me)? They use planners and scheduling calendars, setting up a written means to refer back to what they want to do, not needing too much of a push to get it done. Why can’t I do the same?
Here’s the catch: Sitting down and figuring out what I need to do is boring. For someone with ADHD, being bored feels like torture, like dying (that may sound hyperbolic, but, trust me, it’s not far from the truth), so it’s something I innately want to avoid doing. Even when I force myself through something that bores me, the sheer amount of mental willpower required to do so drains me utterly.
On top of that, most planners, in terms of books that are specifically designed for the purpose of making plans, have a set structure that you are required to conform to in order to use. Things like “Daily Todo List” or “Monthly Plans”, all given specific sections on a page, with little to no room for customization. I’ve yet to come across a planner whose design matches what I feel comfortable with. Do I know what feels comfortable to me? Nope! But every planner I’ve attempted to work with felt dreadful to use, and something that feels dreadful gives me zero motivation to keep using it, especially when it isn’t yielding positive, impactful results.
A logical followup would be to wonder: why not make your own planner, then? Surely, you can figure out what you need and design your planner accordingly, right? Sadly, ADHD also impacts my ability to visualize what works for me. Often, that means I don’t know what I really want. In the moment, something might feel like it would work for the long term, but days later that same strategy might prove chafing to my psyche, for reasons I couldn’t foresee. It’s already difficult, figuring out how to structure a planner that works for all cases; it’s even tougher when I need to use it mid-development to organize the rest of my life. While I did attempt to create custom planners, time and time again they not only proved to be more work than I was willing to force myself to do, they weren’t effective enough to be worth the hard work in the first place.
Without the aid of planners, I resorted to many disparate means of keeping track of what I needed to do. Notes left in places I’d likely be around; notes scattered all over my desk, where I spent much of my day; stacks of things left out on the floor, increasing the chance that I’d remember to deal with them… The overarching problem, aside from it being a disgraceful cacophony of approaches, is that at no point did these scattershot solutions solve for making plans beyond the immediate here and now. If I wanted to do a project, I had to spend all of my spare time focusing on that project; otherwise, I’d get bored of it, or forget about it entirely, and bounce off to the next more interesting project.
I hope these words paint the picture of my life before bullet journaling. I was getting by, technically. But I felt powerless to make true progress on the things I wanted to do.
How I Got Into Bullet Journaling
My wife bought a bullet journal for me in 2016, as a Christmas gift. I intended to try it; in the back of my mind, however, I didn’t feel like this was going to be any different from other times I’d tried to learn new planners. I’d had years of failure and pain built into my memories, and these discouraged me from wanting to make a serious go at bullet journaling.
So, the journal sat around the apartment, being ignored. 2017 came, and passed by. All throughout the year, I kept telling myself I’d give it a shot, and still I never got around to it. At the time, I already had a career in web development, and I was doing my best to keep learning more about web development to improve my chances at getting better-paying jobs. What time wasn’t being spent on that was spent recovering from the difficulty of spending so much of my focus and attention on one specific goal.
Near the end of 2017, Rebecca and I decided that we wanted to try and start a game development studio. Making video games is something I’d always wanted to do, but it wasn’t until now that I felt my programming skills were solid enough that I could attempt to act on this desire. However, I needed to continue building on my web development skills to continue making money from the career that pays our bills. That meant I would have to find a way to juggle working on multiple projects simultaneously, for month after month, year after year; I specifically struggled with this exact thing because of my lack of ability to plan. It became clear: I needed to improve my planning skills, or none of this game development stuff would come to fruition.
I finally had the drive to change, and at the beginning of 2018 I committed to forcing myself to learn how to bullet journal.
I don’t recall if it was a New Year’s Resolution or not, to be honest. It could’ve been, but I simply don’t recall. Personally, I’m not much of a New Year’s resolutions person, anyway; why wait for the new year when you can make a resolution anytime you want?
How I Implemented Bullet Journaling
I started by watching tutorials on YouTube about how bullet journaling works. How To ADHD (by Jessica McAbe), in particular, had great tutorials on bullet journaling that proved helpful to me. To my surprise, I learned that there is no strict formula to making a bullet journal work; you are encouraged to take the parts that work for you, and not worry about the parts that don’t. That was already a major difference from my previous attempts to learn planners: I got to decide what works for me.
Of course, just using a rule-lined notebook technically accomplishes the same thing. The crucial difference is that there were suggested systems for me to use, giving me more than a blank page to work with. At the core of bullet journal philosophy is the daily list of todos: each day, I make a new entry in the bullet journal and write down all the things I need to get done that day. At the end of the day, I mark down what got done, what I moved to a different day, and what I chose to not get done. That is the one habit that was asked of me, to ensure I always make this daily list; this was a far cry from planning systems of the past that made me feel as though I had to plan weeks to months at a time.
What that daily todo entry looks like, visually, is up to me. The bullet journal I was given used dot grid notation, and it is an underrated, but crucial, aspect of making bullet journaling work for me. Personally, ruled paper always suggests that I have to keep my writing between the lines, and it visually discourages me from making any sort of lines that broke from that horizontal structure in any way. Blank paper gives me the freedom to create whatever I want, but it is a lot of effort to make consistent spacing and lines, which are things that help keep me focused. Dot grid paper, on the other hand, provides a symmetric grid of small dots, giving me a sense of where the structure should take place, while not providing explicit lines that make me feel restricted. Honestly, the dot grid paper played a huge role in getting me to buy in to the bullet journal methods.
This is how my first bullet journal was structured.
How Bullet Journaling Helped Me
With simple guidelines, and simple structures on dot grid paper, I slowly integrated use of the bullet journal into my daily routine. It made more than a noticeable impact; it shocked me with just how powerful and effective it was, especially compared to all the other methods of planning I’d attempted throughout my life.
For the first time, ever, I was able to make consistent progress on multiple projects simultaneously. Having a daily reminder of what I needed to do helped me remember what to work on, and having an easy means to keep making a schedule helped ensure that it wasn’t too hard to put my plans to paper. Being able to see at a glance what I needed to do also helped prevent me from jumping off on more interesting projects. This is what I’m working on, I’d tell myself, I want to keep at it so I can finish it.
Incidentally, now that I was writing down my plans, I got better at deciding what I needed to work on. I could research how to do some kind of task, and break it down into parts that I could subsequently schedule. On top of that, the dot grid paper was also great for taking notes down for these projects; the bullet journaling method actually encourages this, as keeping thoughts near your todos helps keep your thoughts nearby without losing them on scattered scraps of paper.
Perhaps most importantly, I made progress on projects. I didn’t bounce off of them, I didn’t have to keep them in the front of my mind, I just did them. For someone like me, this was an awe-inspiring experience. I could actually have a plan to do something, and pull it off while still living other aspects of my life. I’d never known this experience before, and I absolutely loved it.
I also had a much easier time remembering to pay bills on time!
Customizing My Approach
I’ll freely admit: I don’t do bullet journaling exactly as described by the tutorials that I watched. That’s perfectly okay! Using the bullet journal approach, as I’ve stated before, is about adopting the parts that work and discarding the parts that don’t. Where the “official” approach doesn’t provide a feature I want, I’m totally free to add that feature to my bullet journaling method; where it suggests something that I don’t find useful, I ignore it.
For example, the official method suggests creating a “Future Log” that encompasses the next six months, and contains the things you want to accomplish in the distant future. I didn’t find scheduling things out for six months particularly useful, so I created my own approach. It uses the monthly page suggested by the original approach, but I instead make two monthly pages: one that contains the dates and events I need to track for that month, and a “Notes/Tasks/Plans” page which contains the things I want to keep in the back of my mind over the coming month, including plans scheduled further out into the future than a month. This is what works for me, and I’ve not yet seen reason to adjust from it.
The way I structure my todos and notes has also changed since those initial days. Before, I simply placed todo lists at the next blank page in succession. It worked to keep things simple, but I quickly got annoyed with having to hunt between pages of notes to find past todo lists. I decided to impose my own order for todo lists and notes pages: pages from the start of the book are todo lists (daily, weekly, and monthly), while pages from the back of the book are my notes pages. When the two meet, that’s when I start a new bullet journal.
Additionally, the structure of the daily and weekly todos themselves has changed. At first, it was simply making a list on a page where space fit; if a page had enough space for multiple daily todos, I’d add multiple lists. That wasn’t organized enough for my tastes, so I chose to use a half-page structure. Each page would contain two days worth of lists, and no more. After reserving one of the halves for the weekly list, I had a consistent structure where one week’s worth of todos would be predictably spread across exactly four pages. Giving myself a small amount of space for lists also helped me realize when I was trying to put too many things on my list for a given day, and spread things out accordingly.
After using this for nearly a year, I decided to make one more change: instead of each page containing two days worth of todos, each page would represent a single day. The pages were still divided in half, with the top half being dedicated to todos, while the bottom half was reserved for me making notes about things that happened during the day. This change was inspired by a realization: I have trouble recalling what has happened throughout the course of my life. If it wasn’t a major event, it was something I likely wouldn’t be able to recall easily. That troubled me enough that I decided I wanted to have a means of recording at least something about what happened on a particular day. To be honest, it kind of annoys me, but I consider it important enough for my future self that I continue to do it. And since it doesn’t take more than five minutes (if that), it’s not annoying enough for me to give up on it.
Finally, I’ve added my own symbols to the ones officially suggested. Instead of listing what’s different, however, I think it’d be more useful to simply list what symbols I use, since that’s the part which really matters, anyway.
My symbology:
A single dot is an unresolved todo.
A dot with an X is a todo that was completed.
A dot with a forward arrow is a task that I’ve migrated to a future date.
A dot with a backwards arrow is a task that I accomplished on a previous date.
A task that is crossed out is a task that I chose not to do (and didn’t migrate to a future date).
A question mark is a task that is optional. It needs to be resolved, but I’m being clear to myself that it is not required to complete.
An exclamation point is a task that I must complete now or in the immediate future.
A dot within a circle is an event that is taking place.
A question mark within a circle is an event that might happen, but not for certain.
A dash is a note that I want to keep in mind on a daily basis. Keeping it in the daily todos helps me keep it in memory, even if it isn’t strictly a task to accomplish.
I do choose to use the “Bullet Journal”-brand journal, for two reasons: it contains all the journal features I want, such as dot grid paper and three bookmarks, and I have a thing for keeping all my journals consistent, so I continue to buy the brand that I was originally given. Though I don’t mind paying more for my journal material, there are definitely cheaper options which are just as valid!
The structure my bullet journals have used for the last few years. I still have yet to consistently make salads.
Augmenting the Journaling
Bullet Journaling is the planning system that has finally stuck with me, but there’s a catch with all planning systems: you have to remember to use them, or they aren’t effective! To that end, I’ve needed to adopt various strategies outside of the bullet journal to help ensure I don’t forget to keep it up to date.
I try to keep my journal physically located in a centralized location in the place that I live. Right now, this is at the top of the stairs, which I have to pass by every day. Seeing the journal helps jogs my memory that I need to do something with it.
Another thing that significantly helps me is the use of phone alarms. I was already using these to help me remember when I need to take my medications, so it wasn’t hard for me to add additional alarms to remind me to periodically check the bullet journal to ensure I’m not missing time-sensitive things (like calling a doctor’s office during open hours).
An odd thing that I also employ is the use of a habit tracker app on my phone. At least, it seems odd to me, because most of the time I don’t care for systems that employ streak-keeping as the means of positive reinforcement, and most of the time I outright ignore other apps which employ that tactic. For some reason, however, I feel strongly enough about keeping up my habit of completing the bullet journal that, when I see it ask me if I’ve done it yet, it’s enough to get me to stop what I’m doing and go resolve my tasks. Maybe it’s because I care enough about making bullet journaling work that I don’t want to see evidence that I’m flaking away from it? Regardless, this helps ensure that I don’t forget to update the journal over multiple days (which is easy to do with a forgetful short-term memory).
Even though bullet journaling is by far the least painful method of journaling I’ve tried, I do still find it annoying and boring to have to sit down with it and make plans. To help combat this, I’ve designated Thursdays as the day of the week where I force myself to make the plans for the following week (and month, if it’s the last Thursday before the end of the month). That way, I only have to sludge through the boredom one time a week, and it rarely takes more than 10-20 minutes to get everything resolved. I picked Thursday because it gives me a couple of days worth of buffer, should I be unable (or unwilling) to make the new schedule that day.
The Continuous Happy Ending
I opened this article by saying learning how to bullet journal was one of the most important parts of my life, right up there with traditional life-shattering occasions. Before, my lack of focus and good judgment made it very hard to keep working on projects and achieving my goals and dreams. Once I committed myself to bullet journaling, my life has changed dramatically and positively; I can confidently say that, without it, I wouldn’t be having a life as good as I have it today.
I wouldn’t be a game developer. I wouldn’t have a good job that pays well. I wouldn’t have a hope of doing the things I want to do.
If you’ve struggled with making plans, if you have ADHD, if you want to do something that might just change your life for the better…try bullet journaling. I wholeheartedly recommend it.
Speaking of game development, Rebecca and I have released our first game, Sanity Wars Reimagined! Play it on Itch.io to see the progress we’ve made over the past several years, and follow me on social media to see what we’ll do next!
After seven months of development, Rebecca (PixelLunatic) and I have released Sanity Wars Reimagined! Along the way, we learned a lot, lessons we hope to apply to future games we develop. In this article, I want to dig a little bit into what we learned, from what we were initially trying to do to where we wound up, and the various lessons learned and mistakes made along the way.
This project started with a discussion Rebecca and I had about where things were from a long-term standpoint. For the past few years, we’d attempted, and abandoned, various prototypes, and it seemed like we were still far off from actually releasing a product. At the time, I had just come off of a month-long project exploring the creation of game AI; my intent was to start another project aimed at making improvements to the dialogue system. During our discussion, however, Rebecca pointed out that, while our ultimate goal was to make games and sell them, we had a bad habit of not committing to anything long enough to get it released. What’s more, she was concerned that this pattern of starting and abandoning projects wasn’t good for our morale.
She was right to be concerned about this; I’d felt that making an actual release was still a point far off in the distance, and this was making it easier for me to accept the idea of working on non-release projects, to “gain experience”. How would we ever learn how to improve, though, if we never got our projects to a releasable, playable state? Only two of our game jam games and one of our prototypes had ever been given to other people to play, so we had very little feedback on where we needed to improve. I realized that we couldn’t keep waiting to release something until “we got better”; we needed to make something and release it, however bad it may be.
We decided that we would start with a small project, so that it would take less time to get it to a releasable state. To that end, we determined that the project should be a remake of our first jam game, Sanity Wars. By remaking a game that was already released, we thought, we could focus on actually building the parts needed to make the game work; since I’d made those things work previously, we would hopefully avoid the pitfall of trying to create mechanics that were beyond our current skill to implement, or would take too much time to build. Why Sanity Wars? Out of all the previous jam games we’d made, it seemed like the most successful one, so we thought we could just add some polish, redo the art (since Rebecca did not do the original’s art), and it would be fine.
With that, our next project was set: Sanity Wars Reimagined. We would stay faithful to the mechanics of the original, aiming only to remake them in Godot, as this would be quicker than trying to iterate and make new mechanics. I would also take the opportunity to try and make systems that would be reusable in future games; ideally, we would treat Sanity Wars Reimagined as a foundation that we would directly expand upon for the next game. Since the original Sanity Wars was done in three full days, I thought this project wouldn’t take long to complete. Accounting for our busy adult schedules, I estimated the work would take two weeks to complete; at most, a month.
It didn’t take two weeks. It didn’t take a month. It took seven months before we finally released Sanity Wars Reimagined on Itch.io. Along the way, we made significant modifications to the core mechanics, removing multiple parts that were considered essential to the original Sanity Wars; even with those changes, the end result was still not that fun (in our minds). There were many times during the development period where it felt like it was going to drag on and on, with no end in sight. All that said, I still think Sanity Wars Reimagined was a successful release.
Why do I think that? To answer that question, I want to examine what technologies we developed during the project, what mistakes we made, and what we plan to do to improve things for our next project.
Technologies Developed
A lot of what I made from a code standpoint was able to be imported back into my boilerplate Godot project, which will then be available from the start when I clone the Genesis boilerplate to make any future game project. In doing so, I’ve hopefully decreased the amount of development time needed for those projects.
Genesis is name of a tool I created in NodeJS that lets me keep a centralized Godot boilerplate template and create new projects from that boilerplate using simple commands in a command line interface. To give a non-technical summary, it allows me to quickly create and update new Godot projects that include common code that I want to reuse from project to project.
Here are some of the things that I’ll be able to make use of as a result of the work done for Sanity Wars Reimagined:
Resolution Management
There is a lot to consider when supporting multiple resolutions for a game, especially one that uses a pixel art aesthetic. I was already aware of this before committing to figuring out a solution for Sanity Wars Reimagined, but I underestimated just how much more there was to learn. The good news is that I created a solution that not only works for Sanity Wars Reimagined, but is generalized enough that I can use it as the starting point for future games.
I’ll talk in brief about some of the struggles I had to contend with and what I did to solve them.
For starters, when working with pixel art, scaling is a non-trivial issue. Because you are literally placing pixels in precise positions to render your art aesthetic, your scaling must always keep the same aspect ratio as your initial render; on top of that, it must specifically be increased in whole integer factors. This means you can only support a limited number of window sizes without messing up the pixel art. That plays a huge factor in determining what your base size is going to be; since most monitors use a 1920px by 1080px resolution size, your base needs to be a whole integer scale of 1920×1080, or else the game view is not going to actually fill the whole screen when it is maximized to fill the screen (aka fullscreen).
The way fullscreen modes are typically handled for pixel art games, when they attempt to handle it at all, is to set the game view to one of those specific ratios, and letterbox the surrounding area that doesn’t fit cleanly into that ratio. That is the approach I chose for my fullscreen management as well.
Godot does give you the means to scale your game window such that it renders the pixel art cleanly, and you can also write logic to limit supported resolution sizes to only those that scale in whole integers from the base resolution. However, there is a catch with the native way Godot handles this: any UI text that isn’t pixel-perfect becomes blurry, which isn’t a great look to have. I could have switched to only using pixel-perfect fonts, but that wasn’t the look I wanted the game UI to have. After spending a lot of time experimenting with ways to handle this in Godot’s settings, I determined that I would have to create a custom solution to achieve the effect that I wanted.
I wound up talking to Noel Berry (of Extremely OK Games) about how Celeste handled this problem, as its crisp UI over gameplay pixel art was similar to what I was hoping to achieve. He told me that they actually made the UI render at 1920×1080 at default, and then scaled the UI up or down depending on what the game’s current resolution was. This inspired me to create a version of that solution for Sanity Wars Reimagined. I created a UI scaling node that accepts a base resolution, and then changes its scale (and subsequently the scale of its child and grandchild nodes) in response to what the game’s current resolution is. It took a lot of effort, but in the end I was able to get this working correctly, with some minor caveats*.
* I’ll be coming back to these caveats later on in the article, when I discuss mistakes that were made.
Overall, I’m very pleased with the solution I developed for resolution management in Sanity Wars Reimagined, and ideally this is something that should just work for future pixel art-based games.
Screen Management
Another system I developed for Sanity Wars Reimagined is a screen management system that supports using shaders for screen transitions. Although my boilerplate code already included a basic screen manager that was responsible for changing what screens were being currently portrayed (MainMenuScreen, GameScreen, etc.), a significant flaw it had was that it didn’t provide support for doing screen transitions. This was going to be a problem for Sanity Wars Reimagined, as the original game had fade transitions between the different screen elements. I thus set out to refactor my screen management to support doing transitions.
In the original Sanity Wars, the way I accomplished the fade was through manipulating the drawn image in the browser’s canvas element (as the original game was built using HTML/JavaScript, the technologies I was most familiar with at the time). It was hardcoded to the custom engine I’d built, however, and there wasn’t a direct way to achieve the same effect in Godot. It’s possible I could have made the fade transition, specifically, work by manipulating the screen node’s modulation (visibility), but I didn’t feel comfortable making direct changes to node properties for the sake of screen effects, especially if I wanted to have the ability to do other kinds of transitions in the future, such as screen slides or flips; anything more complex than that would be outright impossible through mere node property manipulation.
My focus turned towards experimenting with a different approach, one based on using Godot’s Viewport node to get the actual render textures, and then manipulating the raw pixels by applying shaders to the render images of the outgoing screen and the incoming screen. Viewports were something I hadn’t had much experience with, however, so I wasn’t certain if the idea I had would actually work. To prove the concept, I spent a weekend creating a prototype specifically to test manipulating viewport and their render textures. The approach did, in fact, work as I envisioned (after a lot of research, trial, and error), so I proceeded to refactor the screen management system in Sanity Wars Reimagined to use this new approach.
When referring to screens here, I’m not talking about physical monitor screens; it’s a term I use to refer to a whole collection of elements comprising a section of the game experience. For instance, the Main Menu Screen is what you see on booting up the game, and Game Screen is where the gameplay takes place.
Overall, the refactor was an immense success. The fade effect worked precisely the way it did for the original Sanity Wars, and the system is flexible enough that I feel it should be easy enough to design new screen transition effects (in fact, I did create one as part of making the LoadingScreen, transitioning to an in-between screen that handled providing feedback to the user while the incoming GameScreen prepared the gameplay). Should I want to create different visual effects for future transitions, it should be as simple as writing a shader to handle it. (Not that shaders are simple, but it is far easier to do complex visual effects with shaders than with node property manipulation!)
Automated Export Script
After realizing that I needed to export game builds frequently (more on that later), I quickly found that it was tedious to have to work through Godot’s export interface every time I wanted to make a build. On top of that, Godot doesn’t have native build versioning (at least, not that I’ve found), so I have to manually name each exported build, and keep track of what the version number is. Needless to say, I wondered if there was a way I could automate this process, possibly through augmenting the Genesis scripting tools to include a simple command to export a project.
I took a few days to work through this, and in the end I managed to create functionality in my Genesis scripting tool that did what I wanted. With a simple command, godot-genesis export-project "Sanity Wars Reimagined" "Name Of Export Template", Genesis would handle grabbing a Godot executable and running a shell command to make Godot export the project using the provided export template, and then create a ZIP archive of the resulting export. The name of the export was the project name, followed by a build number using the semantics I chose (major.minor.patch.build). By providing a -b flag, I could also specify what kind of build this was (and thus which build number to increment). It works really well, and now that exports are so easy to do I am more willing to make them frequently, which allows me to quickly make sure my development changes work in the release builds.
Other Features and Improvements
There are many other features that were created for Sanity Wars Reimagined; to save time, I’ll simply give brief summaries of these. Some of these were not generalized enough to be ported back into the Genesis boilerplate, but the experience gained from creating them remains valuable nonetheless.
Generators
These nodes handle spawning entities, and I made the system flexible enough that I can pretty much generate any kind of object I want (though, in this case, I only used it to spawn Eyeballs and Tomes).
RectZone
This is a node which let me specify a rectangular area that other nodes (like Generators) could use to make spatial calculations against (aka figure out where to spawn things).
PixelPerfectCamera
This is a Camera node that was customized to support smoothing behavior rounded to pixel-perfect values. This helps reduce the amount of visual jitter that results from when a camera is positioned between whole integer values.
The reason this happens is because pixels can’t be rendered at fractional, non-integer values, so when a pixel art game asset is placed such that the underlying pixels don’t line up to a whole integer, the game engine’s renderer “guesses” what the actual pixel color values should be. This is barely noticeable for high-resolution assets because they consist of a huge number of pixels, but for something as low-resolution as pixel art, this results in visual artifacts that look terrible.
UI Theming
I finally took a dive into trying to understand how Godot’s theme system works, and as a result I was able to create themes for my UI that made it much simpler to create new UI elements that already worked with the visual design of the interface. I plan to build on my experience with UI themes for future projects, and ultimately want to make a base theme for the Genesis boilerplate, so I don’t have to create new themes from scratch.
State Machine Movement
I converted my previous Player character movement code to be based on a state machine instead of part of the node’s script, and this resulted in movement logic that was far simpler to control and modify.
As you can see, there were a lot of features I developed for Sanity Wars Reimagined, independent of gameplay aspects. A large part of what I created was generalized and reusable, so I can put the code in future projects without having to make modifications to remove Sanity Wars-specific functionality.
Complications
No human endeavor is perfect, and that is certainly true for Sanity Wars Reimagined. In fact, I made a lot of mistakes on this project. Fortunately, all of these mistakes are things I can learn from to make future projects better. I’ll highlight some of these issues and mistakes now.
Both Rebecca and I learned a lot from the mistakes we made developing this project, but I’m specifically focusing on my mistakes in this article.
New Systems Introduced New Complexities
The big systems I added, like Resolution Management and Screen Management, added lots of functionality to the game. With that, however, came gameplay issues that arose as the result of the requirements integrating with these systems introduced.
Take ScreenManager, for example. The system included the ability to have screens running visual updates during the transition, so the screen’s render texture didn’t look like it was frozen while fading from one screen to the next. By creating this capability, however, I needed to modify the existing game logic to take into account the idea that it could be running as part of a screen transition; for instance, the player character needed to be visible on the screen during the transition, but with input disabled so the player couldn’t move while the transition was running.
Another issue the ScreenManager refactor created had to do with resetting the game when the player chose to restart. Before, screens were loaded from file when being switched to, and being unloaded when switched from, so restart logic was as simple as using node _ready() methods to set up the game logic. After the refactor, this was no longer true; to avoid the loading penalty (and subsequent screen freeze) of dealing with loading scenes from file, ScreenManager instead kept inactive screens around in memory, adding them to the scene tree when being transitioned to and removing them from the scene tree when being transitioned from. Since _ready() only runs once, the first time a node enters the scene tree, it was no longer usable as a way to reset game logic. I had to fix this by explicitly creating reset functions that could be called in response to a reset signal emitted by the controlling screen, and throughout the remaining development I encountered bugs stemming from this change in game reset logic.
ResolutionManager, while allowing for crisp-looking UI, created its own problems as well. While the UI could be scaled down as much as I wanted, at smaller resolutions elements would render slightly differently from how they looked at 1920×1080. The reason for this was, ironically, similar to the issues with scaling pixel art: by scaling the UI down, any UI element whose size dimensions did not result in whole-number integers would force Godot’s renderer to have to guess what to render for a particular pixel location on the monitor. Subsequently, some of the UI looked bad at smaller resolutions (such as the outlines around the spell selection indicators). I suspect I could have addressed this issue by tweaking the UI design sizes to scale cleanly, but my attempts to change those values resulted in breaking the UI in ways I couldn’t figure out how to fix (largely due to my continued troubles understanding how to create good UI in Godot). In the end, I decided that, with my limited amount of time, trying to fix all the UI issues was less important than fixing the other issues I was working on, and ultimately the task was cut during the finishing stages of development.
I’m guessing most people won’t notice, anyway, since most people likely have the game at fullscreen, anyway.
Complexities arising from implementing new systems happened in other ways throughout the project as well, although the ones stemming from ScreenManager and ResolutionManager caused some of the bigger headaches. Fixing said issues contributed to extending development time.
Designing for Randomization
One of the core mechanics of Sanity Wars (original and Reimagined) is that all the entities in the game spawn at random locations on an unchanging set of maps. At the time I created the mechanic, my thought was that this was a way to achieve some amount of replayability, by having each run create different placements for the tomes, eyeballs, portals, and player.
Playtesters, however, pointed out that the fully random nature of where things spawned resulted in wide swings of gameplay experience. Sometimes, you got spawns that made runs trivially easy to complete; other times, the spawns made runs much more difficult. This had a negative impact on gameplay experience.
The way to solve this is through creating the means of controlling just how random the processes are. For example, I could add specific locations where portals were allowed to spawn, or add logic to ensure tomes didn’t spawn too close to portals. Adding controlled randomness isn’t easy, however, because by definition it means having to add special conditions to the spawning logic beyond simply picking a location within the map.
The biggest impact of controlled randomness wasn’t directly felt with Sanity Wars Reimagined, however; it was felt in our plans to expand directly off of this project for our next game. Given that random generation was a core element of gameplay, that meant adding additional elements would also need to employ controlled randomness, and that would likely result in a lot of work. On top of that, designing maps with randomness in mind is hard. It would likely take months just to prototype ideas, let alone flesh them out into complete mechanics.
This aspect, more than anything else, was a huge influence in our decision to not expand on Sanity Wars Reimagined for the next project, but to concentrate on a more linear experience. (More on that later.)
Clean Code
If you’re a programmer, you might be surprised at seeing “clean code” as a heading under complications. If you’re not a programmer, let me explain, very roughly, what clean code is: a mindset for writing code in such a way that it is easy to understand, has specific responsibilities, and avoids creating the same lines of code in different files; through these principles one’s code should be easier to comprehend and use throughout your codebase.
Under most circumstances, writing clean code is essential for making code not only easier to work with, but faster to develop. So how did writing clean code make Sanity Wars Reimagined more complex?
Simply put, the issue wasn’t strictly with adhering to clean code principles in and of themselves; the issue was when I spent a lot of time and effort coming up with clean code for flawed systems. Clean code doesn’t mean the things you create with it are perfect. In fact, in Sanity Wars Reimagined, some of the things I created wound up being harmful to the resulting gameplay.
A prime example of how this impacted development is the way I implemented movement for the Eyeball entity. I had the thought of creating a steering behavior-based movement system; rather than giving the entity a point to navigate to and allowing it to move straight there, I wanted to have the entity behave more like real things might move (to put it in very simple terms). I then spent a long time creating a locomotion system that used steering behaviors, trying to make it as clean as possible.
In the end, my efforts to integrate steering behavior movement were successful. There was a huge flaw, however; the movement hampered gameplay. Steering behaviors, by design, are intended to give less-predictable behavior to the human eye, which makes it harder to predict how the eyeball is going to move when it isn’t going in a straight line. This style of movement also meant the Eyeballs could easily get in a position where it was difficult for the player to hit them with the straight-line spirit bullet projectile, which was specifically intended for destroying Eyeballs. Since steering behaviors work by applying forces, rather than explicitly providing movement direction, there wasn’t an easy, feasible way for me to tweak the movement to make it easier for the player to engage with Eyeballs.
In addition to making Eyeballs less fun to play against, the steering behaviors also made it hard to make Eyeballs move in very specific ways. When I was trying to create a dive attack for the Eyeball, I literally had to hack in movement behavior that circumvented the steering behaviors to try and get the attack to visually look the way I wanted to; even then, I still had a lot of trouble getting the movement to look how I felt it should.
How did clean code contribute to this, precisely? Well, I’d spent a lot of time creating the locomotor system and making it as clean an implementation as I possibly could, before throwing it into the gameplay arena to be tested out and refined. If there had been time to do so, I likely would have needed to go back and refactor the Eyeball movement to not use steering behaviors; all that work I’d spent making the steering behavior implementation nice and clean would’ve gone to waste.
Don’t get me wrong; writing clean code is very important, and there is definitely a place for it in game development. The time for that, however, is not while figuring out if the gameplay works; there’s no sense in making something clean if you’re going to end up throwing it out shortly thereafter.
Playtesting
I didn’t let other people playtest the game until way too late in development. Not only did that result in not detecting crashes in release builds, it also meant I ran out of time to properly take feedback from the playtests and incorporate it back into the game.
For the first three months of development, I never created a single release build of Sanity Wars Reimagined. I kept plugging away in development builds. The first time I attempted exporting the project was the day, no, the evening I was scheduled to bring the game to a live-streamed playtest session with IGDA Twin Cities. As a result, it wasn’t until two hours before showtime that I found out that my release builds crashed on load. I spent a frantic hour hack-fixing the things causing the crashes, but even with that, the release build still had a major, game-breaking bug in it: the testers couldn’t complete the game because no portals spawned. Without being able to complete the game, the testers couldn’t give me good feedback on how the game felt to them. From that point onward, I made a point of testing exports regularly so that something like that wouldn’t catch me off-guard again.
The next time I brought the game out for playtesting was in the middle of January 2022, three months after the first playtest. At that point, I’d resigned myself to the fact that Sanity Wars Reimagined didn’t feel fun, and was likely going to be released that way; my intent with attending the playtest was to have people play the game and help me make sure I didn’t have any showstopping bugs I’d need to fix before release. What I wasn’t expecting (and, in retrospect, that was silly of me) was that people had a lot to say about the game design and ways it could be made more fun.
To be honest, I think I’d been stuck so long on the idea that I wanted to faithfully recreate the original game’s mechanics that I didn’t even think about making changes to them. After hearing the feedback, however, I decided that it would be more important to make the game as fun as I could before release, rather than sticking to the original mechanics.
That playtest, however, was one and a half weeks before the planned release date, meaning that I had very little time to attempt making changes of any significance. I did what I could, however. Some of the things I changed included:
Removing the sacrifice aspect of using spells. Players could now access spells right away, without having to sacrifice their maximum sanity.
Giving both the spells dedicated hotkeys, to make them easier (and thus more likely) to be used.
Adding a countdown timer, in the form of reducing the player’s maximum sanity every so often, until the amount was reduced to zero, killing the player. This gave players a sense of urgency that they needed to resolve, which was more interesting than simply exploring the maps with no time constraints.
Changing the Eyeball’s attack to something that clearly telegraphed it was attacking the player, which also made them more fun to interact with.
Adding a scoring system, to give the player something more interesting to do than simply collecting tomes and finding the exit portal.
Various small elements to add juice to the game and make it feel more fun.
Although we did wind up extending the release date by a week (because of dealing with being sick on the intended release week), I was surprised with just how much positive change I was able to introduce in essentially two and a half weeks’ worth of time. I had to sacrifice a lot of clean code principles to do it (feeding into my observation about how doing clean code too early was a problem), but the end result was an experience that was far more fun than it was prior to that play test.
I can only imagine how much more fun the game could’ve been if I’d had people involved with playtesting in the early stages of development, when it would’ve been easier to change core mechanics in response to suggestions.
Thanks to the IGDA Twin Cities playtest group, and specifically Mark LaCroix, Dale LaCroix, and Lane Davis, for offering many of the suggested changes that made it into the final game. Thanks also to Mark, Lane, Patrick Grout, and Peter Shimeall for offering their time to playtest these changes prior to the game’s release.
Lack of a Schedule
I mentioned previously that I’d thought the entire Sanity Wars Reimagined project wouldn’t take more than a month, but I hadn’t actually established a firm deadline for when the project needed to be done. I tried to implement an approach where we’d work on the project “until it felt ready”. I knew deadlines were a way that crunch could be introduced, and I wanted to avoid putting ourselves in a situation where we felt we needed to crunch to make a deadline.
The downside, however, was that there wasn’t any target to shoot for. Frequently, while working on mind-numbing, boring sections of code, I had the dread fear that we could wind up spending many more months on this project before it would be finished. This fear grew significantly the longer I spent working on the project, my initial month-long estimate flying by the wayside like mile markers on a highway.
Finally, out of exasperation, I made the decision to set a release date. Originally, the target was the middle of December 2021, but the game wasn’t anywhere near bug-free enough by that point, so we pivoted to the end of January 2022, instead. As that deadline approached, there were still dozens upon dozens of tasks that had yet to be started. Instead of pushing the deadline out again, however, I went through the list to determine what was truly essential for the game’s release, cancelling every task that failed to meet that criteria.
Things that hit the cutting room floor include:
Adding a second enemy to the game, which would’ve been some form of ground unit.
Refactoring the player’s jump to feel better.
Fixing a bug that caused the jump sound to sometimes not play when it should.
Adding keyboard navigation to menus (meaning you had to use the mouse to click on buttons and such).
Create maps specifically for the release (the ones in the final build are the same as the ones made for the second playtest).
It’s not that these things wouldn’t have improved the game experience; it’s just that they weren’t essential to the game experience, or at least not enough to make it worth extending the release date to incorporate them. By this point, my goal was to finish the game and move on to the next project, where, hopefully, I could do a better job and learn from my mistakes.
These are far from the only complexities that we had to deal with during Sanity Wars Reimagined, but they should serve to prove that a lot of issues were encountered, and a lot of mistakes were made. All of these things, however, are learning opportunities, and we’re excited to improve on the next project.
Improvements for Next Time
There’s a lot of things that I want to try for the next project; many of them serve as attempts to address issues that arose during the development of Sanity Wars Reimagined.
Have A Planned Release Date
I don’t want to feel like there’s no end in sight to the next project, so I fully intend to set a release date target. Will we hit that target? Probably not; I’m not a great estimator, and life tends to throw plenty of curveballs that wreak havoc on plans. By setting an end goal, however, I expect that it will force us to more carefully plan what features we want to try and make for the next game.
In tandem with that, I want to try and establish something closer to a traditional game development pipeline (or, at least, what I understand of one), with multiple clearly-defined phases: prototyping, MVP, alpha, beta, and release. This will hopefully result in lots of experimentation up front that settles into a set of core mechanics, upon which we build lots of content that is rigorously tested prior to release.
Prototype Quickly Instead of Cleanly
Admittedly, the idea of not focusing on making my code clean rankles me a bit, as a developer, but it’s clear that development moves faster when I spend less time being picky about how my code is written. Plus, if I’m going to write something, find out it doesn’t work, and throw it away, I want to figure that out as quickly as possible so I can move on to trying the next idea.
Thus, during the prototyping phase of the next project, I’ll try to not put an emphasis on making the code clean. I won’t try to write messy code, of course, but I’m not going to spend hours figuring out the most ideal way to structure something. That can wait until the core mechanics have been settled on, having been playtested to confirm that said mechanics are fun.
Playtest Sooner Rather Than Later
The feedback I received from the final big playtesting session of Sanity Wars Reimagined was crucial in determining how to make the game more fun before release. For the next project, I don’t want to wait that long to find out what’s working, what’s not, and what I could add to make things even more fun.
I don’t think I’ll take it to public playtesting right away, but I’ll for sure reach out to friends and interested parties and ask them to try out prototype and MVP builds. It should hopefully be much easier to make suggested changes during those early stages, versus the week before release. With more frequent feedback, I can also iterate on things more often, and get the mechanics to be fun before locking them down and creating content for them.
Make a Linear Experience
After realizing how much work it would be to try and craft a good random experience, I’ve decided that I’m going to purposely make the next game a linear experience. In other words, each playthrough of the game won’t have randomness factoring into the gameplay experience. This may be a little more “boring”, but I think doing it this way will make it easier for me to not only practice making good game design, but make good code and good content for as well.
Will it be significantly less fun than something that introduces random elements to the design? Maybe, maybe not. We’ll find out after I attempt it!
Those are just a few of the things I intend to try on the next project. I don’t know if all of the ideas will prove useful in the long run, but they at least make sense to me in the moment. That’s good enough, for now. Whatever we get wrong, we can always iterate on!
Conclusion
That’s the story of Sanity Wars Reimagined. We started the project as an attempt to make a quick release to gain experience creating games, and despite taking significantly longer than planned, and the numerous mistakes made along the way, we still wound up releasing the game. Along the way, we developed numerous technologies, and learned lots of lessons, that should prove immensely useful for our next project. Because of that, despite the resulting game not being as fun as I wish it could’ve been, I consider Sanity Wars Reimagined a success.
What’s next for Rebecca and I? It’ll for sure be another platformer, as that will allow us to make good use of the technologies and processes we’ve already developed for making such games. I fully expect there will be new challenges and complications to tackle over the course of this next project, and I can’t wait to create solutions for them, and learn from whatever mistakes we make!
The game PixelLunatic and I have been working on for the past seven months, Sanity Wars Reimagined, has been officially released! Download it here.
It’s been a long seven months, working on this game, and while there’s still plenty of things that could be improved, overall I’m pleased with how this game turned out. Most importantly, we learned many things that will prove useful for our future game development endeavors.
Note: If you implemented this pattern and are now experiencing issues with get_tree() calls, see my Issues with get_tree() section at the end of the article.
Oftentimes, in code, you need a way to have different parts of the codebase communicate with each other. One way to do this is have those components directly call methods from another component. While that works, it means you directly couple those components together. If you want to reuse one component in another project, you either have to take all the directly-coupled components with it or you have to refactor the direct couplings out of the component you want to reuse, neither of which is desirable from a clean code standpoint.
A way to solve this problem is to use the signal pattern. This is where each component can emit a named signal, and other components can then be connected to that signal. From that point on, whenever that signal is emitted by the component, anything that is listening for that signal can run code in response to that emission. It’s generally a great pattern, allowing for code to indicate when some event, or signal, happens, and for other parts of code to respond to that event accordingly (without code directly relying on calling methods from one another).
There is a third way to have decoupled components communicate to one another: the messenger pattern. At surface level, it’s very similar to the signal pattern: a part of your code dispatches a named message, and any code that is listening for that particular message can respond to it. Those different parts of your code aren’t connected to one another, however; instead, they interact through a Messenger node. Code that wants to listen for a message registers a message listener to the Messenger, and when another part of code dispatches a message with that name, the Messenger loops through all the registered listeners for that message name and invokes their callback functions.
Both the signal pattern and the messenger pattern can be considered subsets of the Observer pattern. The key difference is that the signal pattern has many objects connecting to one (the object emitting the signal), while the messenger pattern has a mediator object through which messages are dispatched and listened for by other objects. Which is better? It depends on what you are trying to accomplish architecturally, and there’s no reason you can’t use both.
Let’s discuss specifics, with relation to what Godot uses. Godot has the signal pattern baked into it at the core. Nodes can define signals through use of the signal keyword. Any node that wants to listen for another node’s signal can connect() to that node’s signal and associate a callback function to it. It looks like this, at a simplified level:
# OrdinaryNode
extends Node
signal some_cool_thing

# DifferentNode
extends Node

func _ready():
  # Assuming both OrdinaryNode and DifferentNode are children of a hypothetical parent node.
  get_parent().get_node('OrdinaryNode').connect('some_cool_thing', self, '_do_something_awesome')

func _do_something_awesome():
  print("This is awesome!")
From then on, whenever OrdinaryNode emits the some_cool_thing signal, the _do_something_awesome() function in DifferentNode will run, printing “This is awesome!”
While this is a good implementation of signals, the nature of how the signal pattern works implies some shortcomings. For instance, all signals must be explicitly defined in code. You can’t have OrdinaryNode, as written above, emit a coffee_break signal because the code didn’t explicitly define that such a signal exists. This is by design, as it means you have to plan what your node can and can’t emit. Sometimes, though, you do want to have a more flexible way to communicate with other nodes, and at that point signals can’t help you. This is one thing the messenger pattern can help with, by not requiring you to explicitly define what messages can or can’t be sent.
Another aspect of the signal pattern is that it requires you to have nodes define a connection to the node emitting the signal if you want those nodes to react to the signal. That means those nodes must, by definition, couple themselves to the node emitting the signal (though the emitter node doesn’t know, or care, about those couplings). This isn’t necessarily bad, but it limits how you can architect your code; you have to make sure nodes that need to listen for a specific signal are able to connect to the node emitting said signal. Conversely, using the messenger pattern, you can have nodes connect only to a single Messenger node, which can be simpler to implement.
Godot does not natively implement such a messenger node, however. If we want to use this messenger pattern, we’ll need to make something ourselves. That’s what this tutorial will be about.
Note: What I’m calling the Messenger Pattern is more commonly known as the Mediator Pattern. I came up with the name Messenger before I learned what it is called, and I’ll continue to use it in this tutorial because I think it communicates more clearly what I’m using it for.
Setting Up
There is a sample project, if you want to refer to the finished product.
If you want to code alongside the tutorial, start by creating a new Godot project, then create a GDScript file named Messenger.gd. We’ll make this as the base file that other implementations of messengers can extend to provide their own functionality.
The original project was created in Godot 3. Here is a branch that is configured for Godot 4. (Thanks to valVk for assisting the Godot 4 conversion!)
Adding and Removing Listeners
The first thing we want to do is provide a way to add and remove message listeners. Let’s begin with adding listeners.
var _message_listeners := {} # Stores nodes that are listening for messages.


# Add object as a listener for the specified message.
func add_listener(message_name: String, object: Object, method_name: String) -> void:
  var listener = { 'object': object, 'object_id': object.get_instance_id(), 'method_name': method_name }

  if _message_listeners.has(message_name) == false:
    _message_listeners[message_name] = {}

  _message_listeners[message_name][object.get_instance_id()] = listener
This is fairly straightforward. We take the name of the message, the object that has the callback function, and the name of the callback. We store all that in a listener dictionary (defined as a class property outside of the function) and store it in _message_listeners in the dictionary stored at the key matching the message name (creating a dictionary for that key if it doesn’t already exist). We key this listener in the message_name dictionary to the object’s instance id, which is guaranteed to be unique.
Since Godot implements signals at the object level (Node inherits from Object), I’ll be typing these as Objects rather than Nodes, which allows for any node inheriting from Object to be used as a listener (including Resources).
Next, the ability to remove a registered listener.
# Remove object from listening for the specified message.
func remove_listener(message_name: String, object: Object) -> void:
  if not _message_listeners.has(message_name):
    return

  if _message_listeners[message_name].has(object.get_instance_id()):
    _message_listeners[message_name].erase(object.get_instance_id())

  if _message_listeners[message_name].empty():
    _message_listeners.erase(message_name)
Again, fairly straightforward. We run existence checks to see if a listener exists at that message_name key, and erase it from the dictionary if so. Additionally, if no more listeners exist for that message_name, we erase the dictionary for listeners of that message name.
Sending Messages
Now that we can add and remove message listeners, it’s time to add the ability to send those messages.
# Sends a message and triggers _callbacks on its listeners.
func dispatch_message(message_name: String, data := {}) -> void:
  var message = { 'name': message_name, 'data': data }

  _process_message_listeners(message)
We take a message_name string and a data dictionary (which defaults to be an empty dictionary), store it to a message variable, and pass that variable into _process_message_listeners.
# Invoke all listener callbacks for specified message.
func _process_message_listeners(message: Dictionary) -> void:
  var message_name = message.name

  # If there aren't any listeners for this message name, we can return early.
  if not _message_listeners.has(message_name):
    return

  # Loop through all listeners of the message and invoke their callback.
  var listeners = _message_listeners[message_name]
  for listener in listeners.values():
    # Invoke the callback.
    listener.object.call(listener.method_name, message.data)
This is where we handle triggering the callbacks for a message listener. If there aren’t any listeners for that message name, we return early to avoid doing further processing. If there are listeners for that message name, then we loop through each one and trigger the stored method callback, passing in the message’s data dictionary.
That’s it, as far as the basic implementation goes. But there are a couple of caveats that need to be dealt with.
Dealing with Nonexistent Listeners
One such case happens when a listener’s object is freed, making the stored reference in the listener dictionary invalid. If you try to operate on it, Godot will crash, so we need to provide a way to scan for dead listeners and remove them from storage.
Let’s start with a function to perform both the check and the purge:
# Removes a listener if it no longer exists, and returns whether the listener was removed.
func _purge_listener(listeners: Dictionary, listener: Dictionary) -> bool:
  var object_exists = !!weakref(listener.node).get_ref() and is_instance_valid(listener.node)

  if !object_exists or listener.node.get_instance_id() != listener.node_id:
    listeners.erase(listener.node_id)
    return true

  return false
Multiple checks are used to see if the object exists (I’ve found in practice that I’ve needed both of these, not just one or the other). We also check to see if the instance id of the stored listener matches the id of the listener object we passed in; honestly, I can’t recall when or why that particular scenario occurs (I sadly forgot to write a comment about it in my code), but I know I’ve encountered it in the past, so I continue to include it as part of my check. If the object doesn’t exist, or the ids don’t match, we conclude the listener’s object no longer exists, and thus remove the listener from storage. Finally, we return a boolean value indicating whether the purge was performed or not.
Now we need to modify our existing code to use this function.
func _process_message_listeners(message: Dictionary) -> void:
  # ...existing logic

  for listener in listeners.values():
    # If the listener has been freed, remove it
    if _purge_listener(listeners, listener):
      # Check if there are any remaining listeners, and erase the message_name from listeners if so.
      if not _message_listeners.has(message_name):
        _message_listeners.erase(message_name)
        return
      else:
        continue

    # ...existing logic
The difference is we call _purge_listener before we try to invoke the callback. If the listener was purged, we perform an additional check to see if there are any other listeners of message_name, and erase the dictionary keyed to message_name if there aren’t; otherwise, we proceed to the next listener in the for loop.
That takes care of dead listeners. There’s one more problem we need to address.
Dispatching Messages Too Early
Right now, if we try to send and listen for messages during the ready process (when Godot’s nodes all run their _ready callbacks), then we’ll likely run into issues where messages are dispatched before the listeners of those messages are registered (because their ready callbacks run later than when the messages are sent). To solve this, we’re going to add a message queue. If a message is being dispatched before the root node of the scene tree is ready, we’ll add the message onto this queue, and once the root node emits its ready signal we’ll process all the messages in the queue.
Let’s start with setting up the message queue, and modifying our dispatch_message function.
var _message_queue := [] # Stores messages that are being deferred until the next physics process tick.
var _messenger_ready := false # Is set to true once the root node is ready, indicating the messenger is ready to process messages.

# Sends a message and triggers _callbacks on its listeners.
func dispatch_message(message_name: String, data := {}) -> void:
  var message = { 'name': message_name, 'data': data }

  if _messenger_ready:
    _process_message_listeners(message)
  else:
    _message_queue.push_back(message)
We’ve added two new class properties, one to house the message queue and the other to mark when the messenger node considers itself ready. dispatch_message has been modified to first check _messenger_ready, and if so it runs the code the same as before. If the messenger node is not ready, then the message is pushed onto the message queue.
Now let’s set up the ability to process the message queue.
func _ready() -> void:
  get_tree().get_root().connect('ready', self, '_on_Root_ready')


# Is called when the root node of the main scene tree emits the ready signal.
func _on_Root_ready() -> void:
  _messenger_ready = true
  _process_message_queue()


# Process all messages in the message queue and reset the queue to an empty array.
func _process_message_queue() -> void:
  for message in _message_queue:
    _process_message_listeners(message)

  _message_queue = []
In Messenger’s own _ready callback, we register a listener to the scene tree root’s ready signal. The callback then sets _messenger_ready to true and calls a function, _process_message_queue(), which loops through each message in the queue and calls _process_message_listeners() on them. At the send, we clear the message queue, since we don’t need (or want) to process these messages again.
Creating a GlobalMessenger
At this point, we have a base Messenger class that can be used anytime we want to implement the messenger pattern in our code. Let’s demonstrate this by creating a global singleton, GlobalMessenger, that we can interact with from anywhere in our codebase.
Start by creating a new file, global_messenger.gd, and have it extend our Messenger class. If Godot claims the Messenger class doesn’t exist, then you’ll need to reload the project to force Godot to update itself and recognize the Messenger class we added in Messenger.gd.
# Creates a global messenger that can be accessed from anywhere in the program.
extends Messenger
The reason I made this file name snake_case is because my personal convention is to name files that are solely used as singletons with this format, to distinguish them from files containing extensible classes. This is my personal preference only, and is not required to make this code work.
That’s all that needs to be done from a code standpoint. To make this a globally-available singleton, we need to go to Project -> Settings in the editor menu, navigate to the AutoLoad tab, and add global_messenger.gd to the list of autoloaded files.
And…that’s it! We now have a global singleton that we can use from anywhere in our codebase to dispatch messages!
Deferring Messages
Let’s add some additional functionality to our global messenger. For instance, right now, once the messenger is ready, we immediately run listener callbacks upon receipt of the message. What if we wanted to defer message dispatches until the next process tick? It might prove useful to ensure all game data is updated by the time your message callbacks are being run.
We already have a message queue that is used to make sure messages are deferred until the messenger is ready. We can build on that to add functionality to intentionally defer message dispatching until the next physics process tick.
func _ready() -> void:
  set_physics_process(false)


func _physics_process(_delta) -> void:
  ._process_message_queue()
  set_physics_process(false) # We don't need to keep updating once messages are processed.


# Queues a message to be dispatched on the next physics processing tick.
func dispatch_message_deferred(message_name: String, data := {}) -> void:
  _message_queue.push_back({ 'name': message_name, 'data': data })

  set_physics_process(true)
First, we use _ready() to disable physics processing. That’s because, whenever _physics_process() is defined in a script file, Godot automatically enables processing. We only want to process when there are messages in queue, so we just disable physics processing right off the bat.
I use _physics_process instead of _process to ensure messages are processed at a consistent rate. physics_process is run a consistent amount of times per second, whereas _process is run as often as possible, and I’ve found that having messages processed as fast as possible can result in unexpected complexity when sent from code that is expecting a consistent frame rate.
Next, in the _physics_process() callback, we call _process_message_queue(), then disable physics processing again (basically, only running the update step a single time).
Finally, we create a new function, dispatch_message_deferred, making it obvious that calling this will be different from a regular message dispatch. We add the message straight onto the message queue. Afterwards, we set the physics processing step to be true. This way, the next time _physics_process() callbacks are run in the code, the global messenger’s _physics_process() callback will be run, too. And since it is a global singleton, it will be run before other nodes in the root scene.
That’s it!
Testing our Implementation
Now that we have a Messenger node, and a GlobalMessenger implementation of it, let’s set up a test scene in our project to test their functionality and make sure they work as intended.
Create a new scene, TestScene, then structure it thusly:
LocalMessenger is a node which is extended from Messenger; we will use this to test that a locally-built implementation of our messenger node works.
The other two nodes, OrdinaryNode and DifferentNode, should contain the following code:
At this point, if you run the scene, you should see the two messages printed to console. If you do, then everything was set up correctly!
Issues with get_tree()
Recently (in May 2023), I encountered a strange bug where a message callback that invoked get_tree() was not returning the scene tree, despite the node housing the callback function being in the scene tree. After some investigation, I realized that I was calling the add_listener() function from the node’s _ready() callback; when I switched to adding the listener in _enter_tree() and removing it in _exit_tree() the get_tree() call worked as expected.
I admittedly am not entirely sure why this works, but my theory is that adding the listener during _ready() is either storing the reference to the function call when the tree is not yet defined or subsequent tree exits and enters is causing the reference to be lost. In any case, I wanted to add this addendum in case anyone else chose to implement this pattern and ran into the same problem.
If you happen to know more info about why this might have happened, please let me know!
Conclusion
We now have a base Messenger node, as well as a GlobalMessenger singleton that extends it and adds defer functionality to it. When should it be used? Personally, I use the messenger pattern in cases where I want to enable node communication, but for whatever reason it doesn’t benefit me to define the specific signals ahead of time, which is when the messenger’s dynamism comes into play.
Of course, that dynamism leads to the risk of making messy code. One advantage to explicitly forcing signals to be defined is that it forces you to think about how you are architecting your code, by making you think clearly about how your signals are going to be used. Since Messenger lets any node send whatever message it wants, it falls on you to make sure that power isn’t abused to send messages when the situation doesn’t call for it. For instance, if you have one node which you want other nearby nodes to listen for a specific event from, you don’t need the dynamic nature of Messenger; signals work perfectly fine, and are a cleaner way to get the job done.
As with all things, in life and code, consider carefully how you do things, and use whatever tools and patterns best fit your needs.
As a programmer, I spend a lot of time figuring out how things should be named and organized. I want things to have readable, comprehensible names, and to be organized in ways that make sense to me. To that end, when I started out in game development, I wanted to figure out how I should organize the files and directories in my game code.
Surprisingly, I’ve found little in my internet searching that speaks to this topic, nor to how things should be named. It just doesn’t seem to be talked about much, and I think that’s a shame. Sure, in the end, the game’s logic doesn’t care where you place your files, or what you call them, but having an understandable code base makes it easier for you to comprehend what particular files are for, without having to look directly at the code or the places that code gets used, and having easy understanding of your code makes for easier development. To that end, I’m writing a high-level overview of my current project, Sanity Wars Reimagined, which contains my latest iteration of my code’s architecture. I’ll show the high-level directory structure, and explain how I came to name those higher-level directories.
Is it something that you should take as gospel and use for all of your projects? No, because everyone’s code needs are different, which is probably part of the reason why articles and videos on this topic aren’t easy to find. What I intend this article to be is an overview on how I structure things and why I do things the way that I do. Hopefully, someone who is looking for inspiration on how to organize their own code might see things they like and incorporate them, saving them the time it took me to figure those things out through trial and experience.
I’ll be the first to admit that, even though generally I like where things are at now, there are still aspects that I’m not entirely satisfied with, so even though I have guidelines on how I should structure things, if my guides don’t make sense, I’ll break away from them to try something that seems better. If they do prove better than my old ways, I’ll incorporate them into my next project. There’s a few instances of this happening in SWR, and I’ll point them out as I go through my code base.
The Project Directory
Without further ado, here is the top level of my SWR directory:
I like to keep my top level relatively simple. The things that go here (other than Godot and VS Code-related files) represent the highest-level reduction of a collection that I could think of. I don’t like seeing too many files and folders at once, as it makes it harder for me to scan the architecture at a glance, so the more I can reduce things, the better.
Note that I’m using Visual Studio Code. Godot lets you plug in third-party editors to use in place of its own built-in editor, and since I use VSC for my day job (web development), I also use it for my game development. There are also things that an external editor shows you that Godot’s editor hides, like markdown files (which I use for my README files) and JSON files (a file format I work with for some kinds of data).
While I’ll generally avoid going into the specifics of how any particular file or system works, I do want to take a moment to explain one particular file in the project directory, the INIT.tscn file. I have a Godot boilerplate project (which I call “Genesis”) that I clone whenever I want to start a new project. Having boilerplate to start with means I can take things I liked about previous projects and incorporate them in a generalized form, so all future projects I make benefit from what I’ve made in the past. How does the INIT file factor into that? That’s the file I’ve marked as the default scene in the Godot project config, and it reads a value in CORE_CONFIG.gd that tells it which screen file I want it to load first. Note that I said screen, not scene. I’ll get more into what screens are later on.
Why not just change the default screen with each project instead of changing my own config value? To give the short explanation, it gives me a consistent, expected environment for my global scripts to hook into. There might be better ways to do it, but this is what I’ve come up with for now, and it works well enough that I haven’t felt a pressing need to change it. An important aspect of architecting code is that there will be plenty of times you feel something isn’t ideal, but running with a slightly imperfect solution is better than spending a lot of time trying to come up with a perfect solution, only to find later on that future scenarios render that perfect solution imperfect. Iteration makes perfection.
Now that we’ve seen everything at a glance, let’s look at each of the top-level directories in my project.
_debug
As explained in previous tutorial posts (starting with this one), I have a custom system that I use to aid with debugging my code in-game, by providing a comprehensive, extensible way to render debugging information widgets. The _debug directory is where I store the code that makes this system work. Since I believe in keeping debug code as isolated from game logic as I can, I keep the scenes and scripts for my debug code in a separate location as well.
Note that I start the directory name with an underscore. In many programming languages, starting a name with an underscore indicates that this is private to some particular scope or class. That’s roughly the idea I’m trying to communicate by using it here. Nothing in _debug is used to make game logic run, so I want the directory name to help communicate that.
_samples and _tests
_samples is something that I include with my boilerplate that contains sample projects demonstrating some of the game systems I’ve built, so I can mess around with them and see how things should look by default. _tests is where all my experiment code goes. If I’m trying to build a new system, I’ll make test directories and files for it in here so I can experiment with the system in isolation before incorporating it with the rest of the game.
One thing about both of these directories is that I specifically filter them out of game exports. These are never intended to be used in my game code, so there’s no reason to include them in official game builds. The reason I don’t do this with _debug as well is because I have to reference the debugging global in my game code to make use of the debugging tools, and I haven’t yet come up with a place to house my debugging global somewhere that makes sense other than in _debug itself. As mentioned before, this is running with a slightly imperfect solution, and if I come up with something that’s better I’ll work it in.
addons
This is what Godot expects you to call the folder which houses third-party engine plugins. I use it for that purpose, of course, but I also use it to house any third-party code (such as GDQuest’s Steering Behaviors AI Framework) that I intend to use exactly as-is in my game code. addons might not be the best name for code serving this latter purpose, but I decided that I preferred to keep all third-party code in a single location instead of using two accurately-named directories, one for proper addons and one for other third-party code. It keeps the top-level architecture simpler, in my opinion.
assets
This is a place where things which are considered resources for other game systems are stored. This includes the obvious in audio and graphics, but also includes scenes that are treated as resources, particles, and shader scripts, among other things. This keeps all those things in one location, and by storing all instances of such things in that one location, I know exactly where to look when I’m looking for anything that I intend to use as some form of content resource.
At the root level of the directory is a README file. This is what I leave for documenting what I intended this directory to be used for, to help future me (and, maybe, future contributors to my game code, should things get to that point) remember what I was thinking. By including this documentation, when I’m considering where to put a new scene or directory, I can refer to a directory’s README file to understand what I intended it to be used for, and see if the new thing I’m making fits that criteria (and if it should fit the criteria and my description says otherwise, I can update the description).
config
This directory is specifically for systems which use some form of scene/node-based configuration, which means they don’t quite fit within the systems directory. This is a new approach I’ve been trying based on past experiences. I’m used to strictly string/file-based configuration files (which is why there is a CORE_CONFIG file at the project level), but making scene-based config files allows for a lot more flexibility in how your configuration works, plus it gives the benefit of using the editor UI to manage your configuration data, which can make for better visual presentation.
Next are the connectors and core directories, but I’m going to skip them for now and come back to them later, as explaining their purpose makes more sense after seeing what the other directories are used for.
effects
This is a directory where I’ve kept scenes that implement a particular effect, such as a 2D trail or shield bubble. Note from the image that there isn’t anything in this directory other than the README file. That’s because I made it part of my boilerplate code, but by default my boilerplate directories don’t include game-specific code.
That said, I’m starting to wonder if this isn’t better served being part of the assets directory. Effects could easily be considered a form of content. This might be something I refactor out in the future.
game_objects
In this directory live all of the objects which get used within the game world, or that augment other game objects. The way I architect this file is the one that is most in flux, since depending on what game I build there could be different ways to classify the game objects. To that end, while I include a default set of directories for the game_objects directory in my boilerplate code, I have the expectation that I’ll likely be making a lot of changes to this architecture.
One subdirectory of game_objects I’ll dig more into is entities. This is where I house any game object that is meant to be rendered visually within the game. Here I store things like the player character, enemies, projectiles, decorative objects, etc. As with the rest of game_objects, the specific architecture of the entities directory is going to adapt whatever structure makes sense for the particular project I’m working on.
There is also a test file, which contains some simple test characters. This predates some of the conventions I’ve come up with for my code, like storing all such test code under _tests, so I plan to refactor this out in the future and move the contents to more appropriate places.
game_world
Here is where I store all scenes that pertain to building the game world. Things like levels, maps, and world areas are included here. Why not make this a part of game_objects, since it could be argued that these are all game objects? I currently think it makes sense to keep things that make up the level formation, such as maps, separate from the objects the populate those worlds. In other words, it’s a personal preference.
The MapManager directory doesn’t really belong here. It’s a system that manages which map is being shown, and although it works with maps, the fact that it’s a system means it would be more accurate to have it be under the systems directory. I’ll probably refactor this at some point.
helpers
These are where files containing generalized helper functions are located. For instance, the MATH helper consists of any functions designed around math calculations that Godot doesn’t provide out of the box. If a helper is system-specific, however, then it would stay with the respective system’s directory instead of being placed here.
screens
This is where I store screens. What’s a screen? It represents whatever collection of systems, game objects, and UI elements the player is currently engaging with. The MainMenuScreen, for example, contains the main menu interactions and visuals. The IntroScreen is where I show the game’s introductory text, TestGameScreen is the screen where actual gameplay for Sanity Wars Reimagined takes place (someday I might remove the “test” prefix because, well, it’s the actual game screen at this point), and the various end screens are where I show the text you see when an end game condition is triggered.
systems
Here reside the various gameplay systems that implement the gameplay for Sanity Wars Reimagined. portals contains the systems logic for making the portals work, while generators contains the base code which is used to control automated spawning of game objects, which is built on for both Eyeball and Tome generation on maps. camera contains the base game objects which implement customized cameras that extend on Godot’s inherent camera nodes.
Didn’t I say game objects belong in the game_objects directory, though? Well, to be more specific, game_objects contains the specific implementations of game objects, whereas any game objects in systems are the foundations on which those specific implementations extend.
Before I move on to ui, I want to go back to one of the directories that we skipped earlier.
connectors
This directory is exclusively for connecting different game systems together. A connector node is a single node that takes two or more other systems nodes as setup arguments, and then applies any connections and custom logic to make those different systems interact with each other. It seems a little convoluted, compared to just building those connections directly into the systems themselves, but, by doing so, I can build individual systems that handle their own logic without directly relying on other systems, and thereby make them easier to reuse with different systems.
Admittedly, this kind of thing isn’t necessarily useful for the specific implementations I’m making for this specific game; the benefit, in theory, will arise from future projects where I want to use certain systems I’ve built for Sanity Wars Reimagined and connect them with the systems of said future projects. I’m still on the fence on whether this abstraction will actually prove useful, but, for now, this is the best solution I’ve come up with to making my systems reusable. If I find a better way to do it in the future, I’ll implement it.
With that out of the way, let’s jump back to
ui
This is both a collection of generalized UI elements that I can build on and the specific implementations of UI elements as shown in my game. Examples of the former include the Sanity gauge and the spell indicator buttons, and an example of the latter is the UI display node which contains the Sanity gauge and each spell indicator being used for the game’s selection of spells.
Given some of the distinctions I’ve made for various game objects, it might seem surprising that I simply lump all the UI elements together. Admittedly, that bothers me a little bit, too, but I haven’t yet thought of a way to cleanly separate the base UI elements and their implementations in a way that makes more sense to me than what I’m doing now. In the meantime, it’s useful for me to know where I store all the UI elements for my game, so they all go here.
Well, not all of them. It’s time now to go back to the other directory I skipped earlier.
core
The core directory, at first glance, looks suspiciously like a microcosm of the project directory, containing directories with names matching the ones I outlined earlier in the article. core is used to contain elements of my code base which I’ve successfully generalized to be reused across any game I make. Therefore, anything housed in core is something which I can safely build specific implementations on top of, without worrying about said things implementing some functionality from a past project.
This is crucial to my approach for making reusable code. Earlier, I mentioned that I make use of Genesis, a boilerplate Godot project. Specifically, the only code that is actually stored in Genesis which gets copied over are the things in this core directory. All the project directories I’ve gone over start out as empty shells, waiting to be filled out with my game-specific implementations that extend from these core systems and files.
What if I need to change how a core system works? In that case, I move the directory/file I need to customize out of core and into its appropriate project-level directory. Why not just modify the things in core directly? It’s out of convention; by enforcing the idea that things in core are never meant to be modified, I can be confident that whatever I build that is on top of a core system or object is something that was designed to work with any project, while something in a project directory, say systems, was designed to specifically work with the current project.
This convention also plays into the scripts I use for managing updating game projects with changes made to the Genesis boilerplate project, such as bug-fixing. Anything in the core directory is something I assume can be straight-up replaced, while anything outside of core needs to receive more manual attention.
That’s All, Folks
That concludes my high-level tour of how I structure my game projects. Again, I’m not saying the way I do things is the best way to organize all game projects; I just wanted to explain how I structure things and the reasons behind those architectural decisions. If you’re looking for ideas on how you should structure your own game projects, I hope my overview helps inspire you to come up with the solutions that work best for you.
I’ve been playing Metroid Dread recently (with one finished playthrough under my belt). It’s the first Metroid game I’ve played (though I’ve played other Metroidvanias), and I absolutely enjoyed it. There are many mechanics that I found fun: the combat is simple, yet engaging; the various abilities you unlock are interesting and lead to great gameplay moments; the level design both helps you avoid getting too lost and still lets you feel like you can explore and discover new areas; and the boss battles are tough, yet fair.
The flagship mechanic, the one that Nintendo advertised heavily, are the EMMI zones. These are designated sections of a map patrolled by a powerful EMMI robot, whose sole purpose is to hunt you down. Your normal weapons can’t hurt the EMMI, so you have to avoid encountering them while moving through their territory. If an EMMI catches you, it kills you unless you succeed on a low-probability counter move. There’s only one way to stop an EMMI for good: finding the energy to power your Omega Cannon, the one weapon you have that can damage them.
EMMI Zones present an action-oriented take on stealth gameplay, and I think they pull the job off well. They’re designed to give you a challenge that you can’t blast your way through, and are crafted such that they don’t put you through too much of their gameplay. In this blog post, I want to examine EMMI zones in two ways: how the game teaches you about the zones, and what mechanics are used to make the zones work.
Note: There will be discussion of some of the abilities you earn throughout the game, though there won’t be any spoilers about the game’s story.
How the Game Teaches You About EMMI Zones
Looking at EMMI zones as a whole, there’s a lot to consider, and it can be a little complex. Metroid Dread spends a good deal of time in the early parts of the game guiding you through the gameplay, using a combination of in-game cutscenes, scripted gameplay, and overt tutorialization. Through these approaches, the game allows you to get used to how EMMI zones work, while still having fun along the way.
The First EMMI Zone
When you first encounter an EMMI, you are shown a cutscene, after which you are given a moment to try and respond to it with what limited abilities you have. The door behind you doesn’t open, and your normal beam weapon and missiles cause no damage to the robot. You are powerless to stop the EMMI from capturing you. At the moment of capture, however, the game pauses, explaining that you have a chance to try and parry the EMMI before it lands a killing blow, and waits to resume until you press the melee counter button. The EMMI freezes in response to this parry, and you are told that you can slide beneath a stunned EMMI. This sequence teaches you what happens when an EMMI catches you, and that you are not powerless to respond to it.
The EMMI recovers from the stun, and you are left to figure out how to run from it. In the next room, the level is designed with a tall wall and platform that you can bounce up and escape. The EMMI is damaged, so even though it tries to follow you, it cannot. The fact that it tries, however, suggests that this is what the other EMMI robots will try to do.
In the very next room is the Omega Cannon, the weapon you need to destroy the EMMI. First, you get a tutorial that teaches you how the Omega Cannon’s charge blast works, by forcing you to use it to open an exit out of the room. Afterwards, you drop back down to face the EMMI, and you have to use the cannon to destroy it and continue on your way.
The Second EMMI Zone
The next EMMI zone is right next to the first one, so you get a chance to try a less hand-held version of EMMI zone gameplay. It starts with a cutscene that reinforces the fact that your normal weapons don’t work against the EMMI (in case you hadn’t realized that, yet). You then have to escape from the EMMI; however, unlike the first one, this EMMI isn’t damaged, so simply climbing up a wall is not enough. You have to evade the EMMI through multiple rooms long until it loses sight of you. This causes it to leave pursuit mode, allowing the EMMI zone doors to unlock and giving you the chance to get out.
From that point, the game leaves you alone, letting you explore more of the world, discovering some new powers and augmentations along the way. The level design forces you to cross back through the EMMI zone multiple times to get to the places you need to go, giving you plenty of experience avoiding the EMMI.
Eventually, you encounter the first Central Unit room, the place where an entity coursing with Omega Energy (the resource that powers your Omega Cannon) is housed. You have to battle this Central Unit, dodging two attacks while blasting the Central Unit with missiles to take down its armored shell and squishy body. Finally, the entity dies, allowing you to siphon its Omega Energy to power the cannon. This time, you are given a second facet to the Omega Cannon: a rapid-fire blast.
As with the first room, the game locks you into the Central Unit’s room and forces you to use your Omega Cannon’s abilities to break out of it. You have to use the rapid-fire to melt the exit door’s heat shield, exposing it to a charge blast which blows it open. This same combination is what you use to defeat the EMMI. This time, when the EMMI dies, you acquire an ability from it, hinting that future EMMI will do the same.
The last major aspect of EMMI zone gameplay comes after you defeat the game’s first boss, where you acquire the Phantom Cloak ability. This turns you invisible for a short period of time. A short briefing explains how the Phantom Cloak can be used to hide yourself from EMMI detection, which is reinforced by a short cutscene when you enter the next EMMI zone, where Samus goes undetected by the next EMMI when she employs the Phantom Cloak.
At this point, you’ve been given the abilities you need to handle any challenge the EMMI zones can throw at you. Along the way, the game gave you a tour of how gameplay within EMMI zones will work, both teaching you through tutorial and allowing you to experiment and try things for yourself.
How do those abilities come together with the rest of the game design to give great gameplay? That’s what I want to examine next.
The Design of EMMI Zone Gameplay
The bulk of gameplay in Metroid Dread consists of exploration, small enemy encounters, and boss fights. Lots of action, lots of things to discover, lots of abilities to unlock progression to other parts of the world. Compared to this run-and-gun style of gameplay, EMMI zones feel tense. You can’t blast your way out of the problem; you have to plan your next moves carefully, with the occasional rapid, improvised escape. This is a good change-up in gameplay, giving you a different style of experience; at the same time, it doesn’t last too long, so you don’t spend too much time under tension, helping you avoid becoming fatigued.
Let’s take a look at the various components which power this experience: level design, evasion, and encounters.
Level Design
There is plenty of great map design in Metroid Dread. Seemingly impossible paths are unlocked by new abilities you discover, clever use of one-way gating keeps you from getting too lost, and many skillful sections conceal power-ups to reward conquering the challenge.
Likewise, the EMMI zones are carefully designed, not just in and of themselves, but also with respect to supplementing the rest of the map design. Each zone is placed on the map such that you are forced to cross through multiple times to accomplish your other goals. At the same time, the EMMI zones are only one part of a larger world, so you aren’t constantly forced to stay long in these high-tension areas. It helps keep the gameplay novel and interesting, without putting too much emphasis on having to play stealthy.
How about the level design within each EMMI zone? By and large, there are two kinds of map design within EMMI zones: large, open spaces where you get plenty of space to move around, and small, narrow corridors that require specific strategies to traverse through safely. While there are rooms within the EMMI zones which are one or the other of those types, often you’ll encounter rooms which mix both types of design together, providing variety in how you plan and execute your evasion. There are also some special areas to help or hinder your approach, including spider magnet walls and ceilings to cling to, pressure plate doors requiring fast maneuvering to blast through, and waterlogged floors that inhibit your movement.
An important aspect of the level design is that it gives you ways to evade the EMMI. When an EMMI has detected your sound, it will pursue your sounds until it finds you or you get far enough away that it stops investigating. The level design supports many strategies for getting out of this pursuit. For instance, you can lead the EMMI off into an isolated part of the map, then double back down a different path to go around it to try and quickly reach your objective. Another way is to take advantage of your mobility to get to areas of the map the EMMI can’t immediately follow you to, forcing it to take another path to get there and increasing the time you have to get out of pursuit range entirely. You just have to look at the map and figure out how best to make your way through safely.
Finally, the visual look of the levels themselves contribute to how the player should feel inside an EMMI zone. While the EMMI is still alive and patrolling, the entire area is grainy and gray, and haunting tones play in the background. Once the EMMI is defeated, the entire area brightens up, the grainy filter is gone, and you hear no more spooky music. Additionally, the world map changes the EMMI zone area to have green backgrounds, indicating you’ve cleared that zone.
Evasion
You can’t hurt the EMMI without the Omega Cannon, and the level design forces you to move in and out of EMMI zones several times before you gain access to the room housing the energy which powers that cannon. That leaves you with two options for dealing with the EMMI while on their turf: running and hiding.
Running is the most obvious solution, and there are various ways the game encourages you to do so and not move too slowly. Your Aeion energy, the ability which powers your Phantom Cloak (and certain other moves) recharges more quickly when you move, so you have to move around at some point to regain your ability to hide. A lot of the map design encourages hiding in a safe spot to plot your next move, then darting over to the next safe spot to repeat the process all over again. The more quickly and carelessly you move, however, the more “noise” Samus makes, increasing the odds that the EMMI will hear you and come to investigate your position. You can risk running for an exit, but if you’re spotted, the EMMI zone exits close until you break the pursuit.
The Phantom Cloak, once you’ve acquired it, allows you to find a spot safe from EMMI wandering and hide from visual detection. While active, it drains your Aeion energy resource, but standing still makes the resource drain significantly less than if you are moving while cloaked. This, along with Aeion energy recharging faster when you move (if you aren’t using an Aeion ability) encourages you to plan your next moves while cloaked, uncloak to execute that plan, then activate the cloak again in your next safe spot to make the next step of your plan. Of course, things don’t always work the way you planned them, and a quick activation of the Phantom Cloak gives you a quick way out of being spotted, hopefully allowing you time to get away from the EMMI threat.
Another aspect of Phantom Cloak is that the game allows it to drain life energy if you run out of Aeion energy while cloaked, and this functions as a risky way to prolong your hidden state. It makes for an interesting player decision: do you continue using the Phantom Cloak and risk losing too much life to deal with enemies beyond the EMMI zone, or do you uncloak and risk the threat of EMMI detection? It presents yet another interesting facet to EMMI zone gameplay.
All the decisions you need to make while in the EMMI zone are aided by the information the game chooses to give you while in the zone. If the EMMI is outside of the screen, but close to you to be within the minimap, a red dot appears on the minimap to indicate its whereabouts. Once an EMMI gets close enough to detect the noises you make, a big yellow circle appears on screen to illuminate the precise area within which it can hear you, and while in this area your sound-making movements are highlighted by smaller yellow circles, letting you know exactly what you’re doing to attract the EMMI’s attention. A blue cone is projected from the EMMI’s face, representing the area in which the EMMI can see you, allowing you to react to its sight and do your best to stay out of it. Finally, if it sees you, the cone turns red during the short moment of time the EMMI spends transitioning to pursuit mode, giving you an opportunity to get a head start on your escape.
Engaging the EMMI
Much of the time you spend in an EMMI zone revolves around avoiding EMMI interaction, because to do so risks death. You can’t run from them forever, though. Let’s take a look at the two ways you can directly interact with the EMMI: attacking it with the Omega Cannon, and attempting to escape its grasp when you are caught.
The Omega Cannon has two forms: one gives you a rapid-fire stream of energy bullets, or the Omega Stream, the other a blast with a charging period, or the Omega Blaster. You need both abilities (after the tutorial zone) to defeat an EMMI: Omega Stream is required to take down the shielding on the EMMI’s head, and Omega Blast is needed to take out the core once the shielding is down.
It takes a lot of rapid-fire shots to take the shielding down, so you’ll need to maneuver through the environment to find long stretches of corridor to give you enough time to land enough shots to take down the shield. Oftentimes, the corridor you’re in isn’t quite long enough to completely destroy the shield, so you have to judge when to disengage and move away to avoid getting caught, and subsequently where you’ll move to next to renew the assault. The shield also regenerates if you haven’t taken it down and you stop damaging it, so it’s not as simple as firing a few shots, moving away, and firing a few more shots; you inherently have to take some risky positioning to make sure you do enough damage in one encounter to not allow the shielding to fully recharge by the next time you position yourself to strike.
Once the shield is taken down, the EMMI is stunned for a brief period of time. If you’re not too close, you can start charging your Omega Blaster during this period. Otherwise, you once again need to move far enough away that you give yourself enough time to charge up the blast and aim for the head. This can lead to some tense, thrilling moments where you hold your ground and manage to get your shot off just before the EMMI catches you.
(Yeah. That was close.)
Something you’ll need to adapt to is the varying speeds EMMI will use when approaching you. Sometimes, they’ll come at you slowly, giving you plenty of time to damage them; other times, they’ll come at you rapidly, and you may find yourself needing to risk your position to get a few more hits in before you move away. The more you engage with an EMMI, the more of a feel you’ll get for the speeds it’ll employ and when it’ll employ them, giving you more information to use in planning your attack.
What if you are caught? When the game launches you into an EMMI capture sequence, you are given two chances to counter the EMMI’s capture strike: once when it grabs at you, and once more when it goes for the killing blow. In both cases, the timing of when the move happens is randomized, so you essentially have to guess when it’s going to come and hope you guessed correctly. You are told that it is almost impossible to counter these blows, which makes it all the more thrilling when you do succeed in landing the parry and are able to escape the EMMI’s clutches. Most of the time, the counter will fail, but by giving you a slim chance of escape, despite failing most of the time you will still feel as though you had some measure of control over your fate.
As someone who specifically dislikes gameplay where failing at stealth immediately results in total failure, I really appreciated this approach to giving you a chance to get out of trouble, even though most of the time I failed to do so.
Even when the EMMI lands the killing blow and you have to reload, the game spawns you just outside of whichever EMMI zone entrance you came through, instead of forcing you to start from wherever you last saved. This allows you to immediately go back in and try again without having to fight your way back; alternatively, if you want to take a break from EMMI zone gameplay, you can wander off and do something else for awhile before diving back in. This is a great approach to minimize player frustration with failure, by making the consequence of it less severe.
There is also something to be said to having an enemy that constant hunts for you, that you can do nothing about but to evade. The feeling you get when your efforts finally lead to you gaining the power to destroy that hunter once and for all is exhilarating, leaving you fired up and raring to take on the next EMMI.
As shown, there are many different mechanics that come together to make up the EMMI zone experience. From the level design, to the various ways you are given to evade the EMMI, to how you engage the EMMI directly, these mechanics come together to provide plenty of experiences for you within an EMMI zone.
Conclusion
Metroid Dread is an awesome game, in my opinion, and a large contributor to that great gameplay are the EMMI zones. You are taught how handle EMMI zones through a combination of guided experiences, cutscenes, and gameplay. Afterwards, the various game mechanics specific to EMMI zones come together to form a tense, challenging experience that straddles the line between being fun and frustrating.
I think the game would be more boring without EMMI zones, and that is a testament to how effectively they are designed. If ever I want to implement action-based stealth mechanics into my own games, I’ll be taking cues from Metroid Dread’s EMMI zones as an example of how to do it right.