I recently encountered an issue with my Godot game, Dice Tower, where clicking around on random parts of the game (like the background of a menu) resulted in focused buttons losing focus to…nothing at all. I didn’t find any search results which got to the root of the actual problem, so I’ll share what I figured out in case someone suffers the same problem in the future.
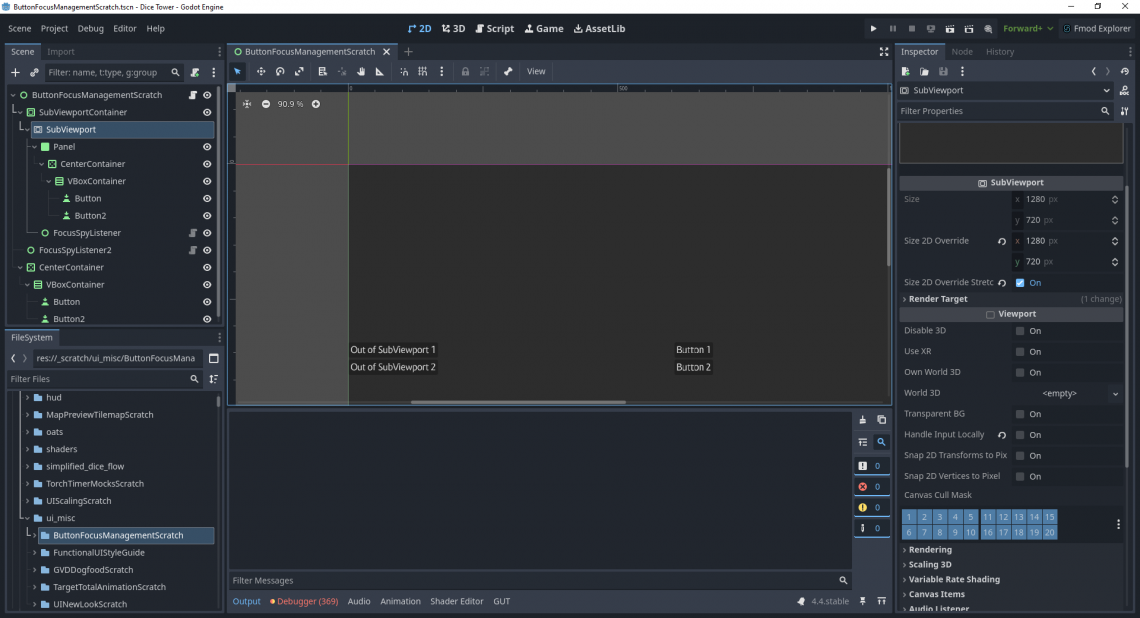
Root Cause: SubViewportContainer nodes default with focus_mode: CLICK.
My game uses a lot of SubViewport nodes for rendering tricks around mixing pixel art and hi-res assets. Accordingly, I also use SubViewportContainer nodes to wrap the viewports and scale them as needed. Because of focus_mode: CLICK (which means focus is grabbed when clicked), that meant any time I clicked on something that itself wasn’t grabbing focus, the SubViewportContainer grabbed that focus, instead.
Ultimately, it wasn’t a hard fix. However, at no point during my internet sleuthing did I come across any articles that suggested this was the problem. I only figured it out by creating a test scene and experimenting with different configurations of nodes and viewports to fix the perceived behavior. Thus, I wrote this article.
Hopefully, if you are also trying to figure out why clicking on random stuff loses button focus, this article saved you time in figuring out the problem. Comment if it did!
Tonight, I gave a presentation for my local IGDA chapter (Twin Cities) called Stop Waiting for Godot: Introducing You to the Godot Game Engine. This is a high-level overview of what Godot is and what you can do with it, intended to give you a taste of what working with Godot is like. You can watch the recording here, on IGDATC’s YouTube channel!
Welcome to Part 3 of my tutorial for creating a debugging interface in Godot! In Part 1, we created the base for our debugging system, and in Part 2 we created debug widgets to show our debugging information. If you haven’t read those parts, you would be advised to do so before continuing on with this part. Alternatively, if you want to start from this part, and just need the end code from the preceding parts, you can check out the tutorial-part-2 branch from the Github repo.
At this point, we have a debugging interface that we can toggle on and off, and we have a base DebugWidget class to build our debug widget from, as well as a DebugTextList debug widget. We don’t quite have everything we’d ideally want in a debugging system, though. What happens if we want to display different debug widgets, and not have to see all of them at the same time? What if we have a lot of debug widgets, so much so that they take up most of the screen space, making it impossible to see the underlying game beneath the cluttered visuals?
We could try creating multiple DebugLayer nodes, but this would quickly become brittle and clunky. As the DebugLayer is exposed globally for our code to access, any additional DebugLayer nodes would also need to be global, which would pollute the AutoLoad declarations. It would also mean having to remember which DebugLayer you’re connecting to, as well as assigning different keys to show and hide each layer so that they don’t all show at the same time… Suffice it to say, doing things this way is awful.
It would be better to create a system specifically for showing different debugging interfaces, depending on whatever criteria we choose to specify. We’ll do this by creating a new type of node, the DebugContainer, and modifying DebugLayer to be capable of managing multiple DebugContainer nodes.
If you want to see the final result, you can check out the tutorial-part-3 branch in the Github repo.
Ready? Let’s go!
Creating the DebugContainer
Begin by creating a new script file, DebugContainer.gd, in the _debug directory. Have it extend MarginContainer. We’ll begin by adding this line of code:
# The list of widget keywords associated with the DebugContainer.
var _widget_keywords = {}
Wait a minute, you say. That looks suspiciously like the code we added to DebugLayer.gd in the previous part of this tutorial. Well, you’re right! That’s exactly what it is. Our goal is to move management of individual DebugWidget nodes out of DebugLayer and into DebugContainer nodes, so it makes sense to go ahead and store the widget keywords here.
Moving Widget Code from DebugLayer to DebugContainer
In fact, we’re going to move most of the code we added to DebugLayer for managing debug widgets into DebugContainer.gd. Let’s take care of that right now:
func _ready():
    mouse_filter = MOUSE_FILTER_IGNORE
    _register_debug_widgets(self)
    Debug.register_debug_container(self)


# Adds a widget keyword to the registry.
func _add_widget_keyword(widget_keyword: String, widget_node: Node) -> void:
  var widget_node_name = widget_node.name if 'name' in widget_node else str(widget_node)

  if not _widget_keywords.has(widget_node_name):
    _widget_keywords[widget_node_name] = {}

  if not _widget_keywords[widget_node_name].has(widget_keyword):
    _widget_keywords[widget_node_name][widget_keyword] = widget_node
  else:
    var widget = _widget_keywords[widget_node_name][widget_keyword]
    var widget_name = widget.name if 'name' in widget else str(widget)
    push_error('DebugContainer._add_widget_keyword(): Widget keyword "' + widget_node_name + '.' + widget_keyword + '" already exists (' + widget_name + ')')
    return


# Go through all children of provided node and register any DebugWidgets found.
func _register_debug_widgets(node) -> void:
  for child in node.get_children():
    if child is DebugWidget:
      register_debug_widget(child)
    elif child.get_child_count() > 0:
      _register_debug_widgets(child)


# Register a single DebugWidget to the DebugContainer.
func register_debug_widget(widgetNode) -> void:
  for widget_keyword in widgetNode.get_widget_keywords():
    _add_widget_keyword(widget_keyword, widgetNode)


# Sends data to the widget with widget_name, triggering the callback for widget_keyword.
func update_widget(widget_path: String, data) -> void:
  var split_widget_path = widget_path.split('.')
  if split_widget_path.size() == 1 or split_widget_path.size() > 2:
    push_error('DebugContainer.update_widget(): widget_path formatted incorrectly. ("' + widget_path + '")')

  var widget_name = split_widget_path[0]
  var widget_keyword = split_widget_path[1]

  if _widget_keywords.has(widget_name) and _widget_keywords[widget_name].has(widget_keyword):
    _widget_keywords[widget_name][widget_keyword].handle_callback(widget_keyword, data)
  else:
    push_error('DebugContainer.update_widget(): Widget name and keyword "' + widget_name + '.' + widget_keyword  + '" not found (' + str(_widget_keywords) + ')')
Almost all of the code above is code we worked on in Part 2 of this tutorial. If you need any refreshers on how that code works, feel free to review that part.
There are a couple of differences to the code that need to be pointed out; both are in the _ready() function. First, the mouse_filter = MOUSE_FILTER_IGNORE line.
By default, mouse_filter is equal to MOUSE_FILTER_PASS. That value means that, when you render a UI node, mouse interactions are captured by the first UI element that decides to handle it. If you have two UI nodes, and you click on that stack, the “top” node will receive the mouse event first. If it doesn’t handle the event, it gets passed to any nodes below it. If it does do something with the event, however, then the event is considered to be handled, and is no longer passed on to other nodes.
With that information, let’s think about how our debugging system is implemented. We made DebugLayer a CanvasLayer node that is rendered at the highest level possible. Because of this, anything in DebugLayer will receive mouse events before anything else in the game. Since control nodes default to using the MOUSE_FILTER_PASS setting, that means DebugLayer will consume any mouse events while it is being shown, preventing interaction with the underlying game. That is behavior we definitely don’t want. That is why we set mouse_filter to MOUSE_FILTER_IGNORE for DebugContainer, so that it will ignore any mouse events, allowing them to proceed down to the underlying game nodes.
The other thing to note about the code we’re adding is the call to Debug.register_debug_container(). This will be how our debug container registers itself with the DebugLayer, much like what we did with debug widgets in the previous part of the tutorial.
If you’re copying code over from your project, don’t forget to update the error messaging and code documentation to say DebugContainer instead of DebugLayer.
Modifying DebugLayer to use DebugContainers
We’re going to need to add register_debug_container() to DebugLayer.gd. Before we do so, however, we need to make some other changes to the DebugLayer scene, itself:
Remove the TextList1 node we created in the previous tutorial; we’re no longer going to store debug widgets directly in the DebugLayer scene.
Select the DebugUIContainer node, click on the Layout tab, and select “Full Screen”.
Add a VBoxContainer child to DebugUIContainer.
Add a Tabs node and a MarginContainer node as children of the VBoxContainer (in that order).
Name those last two nodes DebugTabs and DebugContentContainer.
Go to the DebugTabs node properties and set Tab Alignment to left.
That takes care of the scene. Let’s move on to modifying the script. If you haven’t done so already, remove the code implementing debug widgets in DebugLayer (aka the stuff we moved into DebugContainer). Once that’s done, add the register_debug_container() function and the related code that is part of its implementation:
signal debug_container_registered


# The debug containers registered to the DebugLayer.
var _debug_containers = {}

# The currently active debug container.
var _debugContainer: Node

# Nodes implementing the debug container tab switching interface.
onready var debugTabs = $DebugUIContainer/VBoxContainer/DebugTabs
onready var debugContentContainer = $DebugUIContainer/VBoxContainer/DebugContentContainer


func _input(_event) -> void:
  if Input.is_action_just_pressed('toggle_debug_interface'):
    # ...existing code
    _debugContainer.show()


func register_debug_container(containerNode) -> void:
  var container_name = containerNode.name
  if _debug_containers.has(container_name):
    push_error('DebugLayer.register_debug_container: Debug already has registered DebugContainer with name "' + container_name + '".')
    return

  # Reparent the container node to the DebugLayer.
  containerNode.get_parent().call_deferred('remove_child', containerNode)
  debugContentContainer.call_deferred('add_child', containerNode)
  debugTabs.add_tab(container_name)

  _debug_containers[container_name] = containerNode
  if _debug_containers.size() == 1:
    _debugContainer = containerNode

  # Hide this container node so we don't show debug info by default.
  containerNode.hide()

  emit_signal('debug_container_registered', containerNode)
That’s quite a chunk of code. Let’s unpack this and see what everything does.
First, we add a signal, debug_container_registered, which we’ll dispatch whenever a debug container is registered. Next, we add _debug_containers, which will be used the same way that we used _debug_widgets, just for debug containers instead of debug widgets. We also add _debugContainer to keep track of the currently shown debug container’s node.
We define references for two of the UI nodes we added to the DebugLayer scene, debugTabs and debugContentContainer. For now, we’ll ignore these in favor of explaining other parts of the added code. Don’t worry, we’ll explain what these nodes are used for as we progress through the tutorial.
Continuing on, we modify our _input() function to show the current debug container node whenever we toggle on the debug interface. And finally, at long last, we have the register_debug_container() function, itself.
In register_debug_container(), we first get the name of the passed-in containerNode and check to see if that name is already registered; if it is, we show an error and return without doing anything else. Next, we need to reparent the containerNode from wherever it currently is in the scene tree to become a child of debugContentContainer. Note the use of call_deferred(), rather than invoking the functions directly; this calls the specified functions during Godot’s idle time, which prevents issues that can occur when running code within nodes that are being reparented.
We’re going to allow DebugContainer nodes to be added pretty much wherever we want when creating our scenes, so we need to move them inside the DebugLayer at runtime to ensure they get displayed as part of the debugging interface. This should make more sense once we get to the part where we start using debug containers.
After the reparenting is finished, we add a new tab to the DebugTabs node, entitled the debug container’s name. Then we add the containerNode to the dictionary of debug containers; if it’s the first debug container we’ve registered, we set it to be the initially-shown debug container. We want to make sure that our debug containers aren’t visible by default (otherwise, we’ll see every debug container all at once), so we call hide() on the containerNode. Finally, we emit the debug_container_registered signal, so anything that wants to listen for that will know when a debug container is registered, and which one it is.
I have not needed to make use of this signal yet in my personal use of the debugging system, but it seems like a potentially useful thing to expose, so it makes sense to go ahead and do so.
Now that we’ve implemented the register_debug_container() function, it’s time to take a closer look at the DebugTabs node and make it work.
DebugTabs
The Tabs node in Godot is a basic tabs implementation. It does no view switching by itself; instead, when we switch between tabs, a signal is fired indicating which tab was switched to, and it’s up to our code to listen for that signal and respond to it. We’re going to use this functionality to change which debug container is the one being shown in DebugLayer.
Godot does provide a TabsContainer node, which would implement both the tabs and view switching. However, since it is a single node, if you ignore mouse events (as we mentioned needing to add for DebugContainer), then you can’t click on the tabs. If you leave the node able to capture mouse events, it will prevent interacting with the game when the debug interface is open. Thus, I’ve opted to just use the Tabs node and implement view switching manually.
The code to implement the view switching is rather simple:
During _ready(), we connect to the tab_changed signal for debugTabs and provide an _on_Tab_changed() callback. In the callback, we get the name of the tab (based on the tab_index provided as the callback function’s argument), and use that name to find the registered debug container with matching name. We then hide the currently-visible debug container, switch the _debugContainer variable to be the upcoming containerNode, and then make that debug container visible.
Updating Widgets
We’re still missing one important functionality: sending data to update our debug widgets. Since we moved our previous implementation of update_widget() into the DebugContainer node, we’ll need to create a new version of update_widget() that determines which debug container the widget data should be sent to.
# Sends data to the debug container specified in widget_path.
# API: container_name:widget_name.widget_keyword
func update_widget(widget_path: String, data = null) -> void:
  var split_keyword = widget_path.split(':')
  if split_keyword.size() == 1:
    push_error('DebugLayer.update_widget(): No container name was specified. (' + widget_path + ', ' + str(data) + ')')
    return

  var container_name = split_keyword[0]
  if not _debug_containers.has(container_name):
    push_error('DebugLayer.update_widget(): Container with name "' + container_name + '" is not registered.')
    return

  var containerNode = _debug_containers[container_name]
  widget_path = split_keyword[1]
  containerNode.update_widget(widget_path, data)
Notice that the arguments are still the same: we’re passing in a widget_path and data. However, we need a way to indicate which debug container has the debug widget we want to update.
To do this, we’re going to modify the widget_path API slightly. Instead of starting the string with the name of the debug widget, we’ll start with the name of the debug container, and delimit it with a colon, :.
We implement this in code by splitting the widget_path string on said colon and verifying that there was indeed a debug container name passed in. If no container name was provided, then we show an error and return without doing anything further; we do the same if the provided debug container’s name doesn’t exist in our dictionary of registered debug containers. If all is valid, then we get the specified debug container and call its update_widget() function, passing in the other half of our split string (aka the original widget_name.widget_keyword API), as well as data.
At this point, we’re almost ready to run the test scene to try our changes, but there’s something we need to do first: modify our test scene to support the changes we’ve made to our Debug API.
Adding a DebugContainer to the Test Scene
Let’s go straight to our TestScene scene and add one of our new DebugContainer nodes; name it “TestDebugContainer”. As a child of that, add a DebugTextList debug widget with the name “TextList1”. Finally, go to TestScene.gd and change our call to Debug.update_widget() to incorporate our new syntax for specifying the debug container in the widget_path.
Now we can run the test scene and see our changes in action! If you press the debug toggle key combination we defined earlier (Shift + `), you should be able to see the same counting text that we saw before. Additionally, you should be able to see the tab we just added, titled "TestDebugContainer".
If that's what you see, good job! If not, review the tutorial (and perhaps the repo code) to try and identify where things went wrong.
Testing with Multiple Debug Containers
That said, these are things we've seen before (aside from the tab). We made these changes to support being able to show different debugging views via multiple debug containers. Let's go ahead and add another one!
Duplicate the TestDebugContainer node (which will create a copy of both that node and the child debug widget; the TestDebugContainer node will be automatically named "TestDebugContainer2"), then go to TestScene.gd and add two new calls to Debug.update_widget() as shown below:
As you can see, we're simply changing the widget_path to request TestDebugContainer2 instead of TestDebugContainer. To keep the test simple, our second call is showing the same test_ct variable, but divided by ten and rounded to the nearest integer.
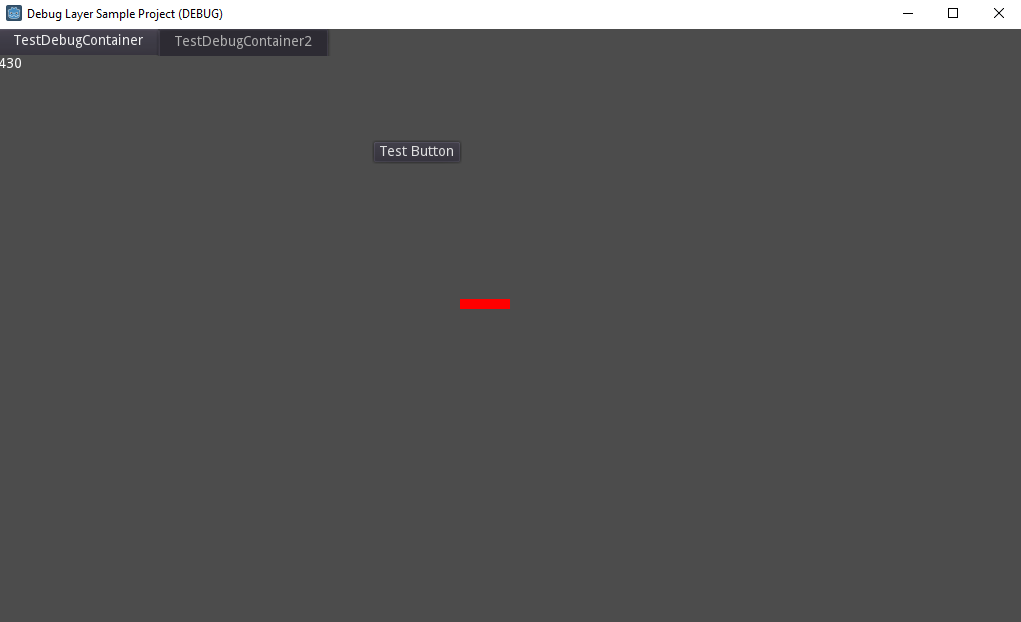
That's it! No, seriously! Go ahead and run the scene again, and everything should "just work". You'll see two tabs, one named "TestDebugContainer" and the other named "TestDebugContainer2". Switching between them will alternate between showing the original counter and the rounded version.
But wait, there's more! We can add these debug containers anywhere in our scene structure, and as long as those scenes are part of the currently-running scene tree they'll register themselves to our debugging interface.
To test this, let's create a quick child scene to add to our test scene. Create a new scene called "TestChild" (based on Node), then add a button with text "Test Button" and place it near the top-center of the child scene. Add a DebugContainer with DebugTextList child to TestChild, and make sure you rename them to "TestDebugContainer2" and "TextList1" (to match the widget_path we've defined in the TestScene.gd script). Instance TestChild into TestScene and remove the TestDebugContainer2 node that was in TestScene.
Run the test scene, and you get exactly the same result as before. You can see both the tabs, and switch between them with ease. The only difference is that one debug container originated in TestScene, and the other in TestChild.
If you see the TestDebugContainer2 tab, but not the counter, that means you forgot to make the debug node names and the widget_key string match, so you're not actually sending updates to the correct location.
Fixing One Last Bug
Before we get too hyped with excitement, however, there is a bug that we need to take care of. Run the test scene, open the debugging interface, and hover over the button we added to the TestChild scene. Nothing seems to happen, right? Now close the debugging interface and hover over the button again. This time, it lights up, indicating that it's receiving mouse events. That means something in our debugging interface is intercepting mouse events.
Fortunately, this is a simple fix: we just need to go to the DebugLayer scene and change the mouse_filter properties for DebugUIContainer, VBoxContainer, and DebugContentContainer to MOUSE_FILTER_IGNORE (shown as just Ignore in the editor interface). Do not, however, change the mouse_filter property for DebugTabs, or you may find yourself unable to click on the tabs at all!
Once you've made those changes, run the test scene again. This time, you should be able to trigger the button hover state when the debug interface is open.
Congratulations!
We now have DebugContainer nodes, which we can add wherever we want, and add whatever debug widgets we want to them, using the tabbed interface to switch between whichever debugging views we want to see. And best of all, it's simple to add these debug containers and widget as we need them, whether for temporarily reporting data or for permanent display of debugging information.
With these things, you have the essentials needed to build on this debugging system and make it your own. Create widgets that show you the information that you need to know. As shown in this tutorial, it's easy to make a new debug widget, and just as easy to register it to the debugging system. Using this system has definitely made my game development much easier, and I hope the same will be true for you!
If you want to see the code as it was at the end of this part, check out the tutorial-part-3 branch in the Github repo.
Welcome to Part 2 of my tutorial for creating a debugging interface in Godot! In Part 1, we created the base for our debugging system. If you haven’t read that part, you should do so now, because the rest of the tutorial series will be building atop it. Alternatively, if you just want the code from the end of Part 1, you can check out the tutorial-part-1 branch in the Github repo.
At this point, we have the base of a debugging system, but that’s all it is: a base. We need to add things to it that will render the debugging information we want to show, as well as an API to DebugLayer that is responsible for communicating this information.
We’ll do this through “debug widgets”. What’s a debug widget? It’s a self-contained node that accepts a set of data, then displays it in a way specific to that individual widget. We’ll make a base DebugWidget node, to provide common functionalities, then make other debug widgets extend that base that implement their custom functionalities on top of the base node.
Alright, enough high-level architecture talk. Let’s dive in and make these changes!
Creating the Base DebugWidget
To get started, we want a place to store our debug widgets. To that end, make a new directory in _debug, called widgets. In this new widgets directory, create a new script called DebugWidget.gd, extending MarginContainer.
# Base class for nodes that are meant to be used with the DebugLayer system.
class_name DebugWidget
extends MarginContainer
Note the custom class_name. This is important, because later on we’ll be using it to check whether a given node is a debug widget.
You may need to reload your Godot project to ensure that the custom class_name gets registered.
Next, we’re going to add something called “widget keywords”:
# Abstract method which must be overridden by the inheriting debug widget.
# Returns the list of widget keywords. Responses to multiple keywords should be provided in _callback.
func get_widget_keywords() -> Array:
  push_error("DebugWidget.get_widget_keywords(): No widget keywords have been defined. Did you override the base DebugWidget.get_widget_keywords() method?")
  return []
This function will be responsible for returning a debug widget’s widget keywords. What are widget keywords, though?
To give a brief explanation, widget keywords are the way we’re going to expose what functionalities this debug widget provides to the debugging system. When we want to send data to a widget, the debugging system will search through a list of stored widget keywords, and if it finds one matching the one we supply in the data-sending function, it will run a callback associated with that widget keyword.
If that doesn’t make much sense right now, don’t worry. As you implement the rest of the flow, it should become clearer what widget keywords do.
One thing to note about the code is that we’re requiring inheriting classes to override the method. This is essentially an implementation of the interface pattern (since GDScript doesn’t provide an official way to do interfaces).
Let’s add a couple more functions to DebugWidget.gd:
# Abstract method which must be overridden by the inheriting debug widget.
# Handles the widget's response when one of its keywords has been invoked.
func _callback(widget_keyword, data) -> void:
  push_error('DebugWidget._callback(): No callback has been defined. (' + widget_keyword + ', ' + data + ')')


# Called by DebugContainer when one of its widget keywords has been invoked.
func handle_callback(widget_keyword: String, data) -> void:
  _callback(widget_keyword, data)
handle_callback() is responsible for calling the _callback() function. Right now, that’s all it does. We’ll eventually also do some pre-callback validation in this function, but we won’t get into that just yet.
_callback() is another method that we explicitly want the inheriting class to extend. Essentially, this is what will be run whenever something uses one of the debug widget’s keywords. Nothing is happening there right now; all the action is going to be in the inheriting debug widgets.
That’s it for the base DebugWidget. Time to extend that base!
Creating the DebugTextList DebugWidget
Remember that DebugLabel that was discussed at the beginning of the article? Having a text label that you can update as needed is a useful thing for a debugging system to have. Why stop with a single label, though? Why not create a debug widget that is a list of labels, which you can update with multiple bits of data?
That’s the debug widget we’re going to create. I call it the DebugTextList.
I prefix debug widget nodes with Debug, to indicate that they are only meant to be used for debugging purposes. It also makes it easy to find them when searching for scenes to instance.
Create a directory in widgets called TextList, then create a DebugTextListscene (not script). If you’ve registered the DebugWidget class, you can extend the scene from that; otherwise, this is the point where you’ll need to reload the project in order to get access to that custom class.
Why create it as a scene, and not as another custom node? Really, it’s simply so that we can create the node tree for our debug widget using the editor’s graphical interface, making it simpler to understand. It’s possible to add the same child nodes through a script, and thereby make it possible to make the DebugTextList a custom node. For this tutorial, however, I’m going to keep using the scene-based way, for simplicity.
Alright, let’s get back on with the tutorial.
Add a VBoxContainer child node to the DebugTextList root node. Afterwards, attach a new script to the DebugTextList scene, naming it DebugTextList.gd, and have it extend DebugWidget. Replace the default script text with the following code:
listNode is a reference to the VBoxContainer. We also have defined a const, WIDGET_KEYWORDS, which will define the widget keywords this debug widget supports. Technically, you could just use the keyword’s strings where needed, rather than define a const, but using the const is easier, as you can see below.
# Handles the widget's response when one of its keywords has been invoked.
func _callback(widget_keyword: String, data) -> void:
  match widget_keyword:
    WIDGET_KEYWORDS.ADD_LABEL:
      add_label(data.name, str(data.value))
    WIDGET_KEYWORDS.REMOVE_LABEL:
      remove_label(data.name)
    _:
      push_error('DebugTextList._callback(): widget_keyword not found. (' + widget_keyword + '", "' + name + '", "' + str(WIDGET_KEYWORDS) + '")')


# Returns the list of widget keywords.
func get_widget_keywords() -> Array:
  return [
    WIDGET_KEYWORDS.ADD_LABEL,
    WIDGET_KEYWORDS.REMOVE_LABEL
  ]
Notice that we’re overriding both _callback() and get_widget_keywords(). The latter returns the two widget keywords we defined in the const, while the former performs a match check against the widget_keyword argument to see if it matches one of our two defined keywords, running a corresponding function if so. By using the const to define our widget keywords, we’ve made it easier to ensure that the same values get used in all the places needed in our code.
match is Godot’s version of implementing the switch/case pattern used in other languages (well, it’s slightly different, but most of the time you can treat it as such). You can read more about it here. The underscore in the match declaration represents the default case, or what happens if widget_keyword doesn’t match our widget keywords.
Let’s go ahead and add the two response functions now: add_label() and remove_label(). We’ll also add a helper function that is used by both, _find_child_by_name().
# Returns a child node named child_name, or null if no child by that name is found.
func _find_child_by_name(child_name: String) -> Node:
  for child in listNode.get_children():
    if 'name' in child and child.name == child_name:
      return child

  return null


# Adds a label to the list, or updates label text if label_name matches an existing label's name.
func add_label(label_name: String, text_content: String) -> void:
  var existingLabel = _find_child_by_name(label_name)
  if existingLabel:
    existingLabel.text = text_content
    return

  var labelNode = Label.new()
  labelNode.name = label_name
  labelNode.text = text_content
  listNode.add_child(labelNode)


func remove_label(label_name) -> void:
  var labelNode = _find_child_by_name(label_name)
  if labelNode:
    listNode.remove_child(labelNode)
_find_child_by_name() takes a given child_name, loops through the children of listNode to see if any share that name, and returns that child if so. Otherwise, it returns null.
add_label() uses that function to see if a label with that name already exists. If the label exists, then it is updated with text_content. If it doesn’t exist, then a new label is created, given the name label_name and text text_content, and added as a child of listNode.
remove_label() looks for an existing child label, and removes it if found.
With this code, we now have a brand-new debug widget to use for our debugging purposes. It’s not quite ready for use to use, yet. We’re going to have to make changes to DebugLayer in order to make use of these debug widgets.
Modifying DebugLayer
Back in Part 1 of this tutorial, we made the DebugLayer scene a global AutoLoad, to make it accessible from any part of our code. Now, we need to add an API to allow game code to send information through DebugLayer to the debug widgets it contains.
Let’s start by adding a dictionary for keywords that DebugLayer will be responsible for keeping track of.
# The list of widget keywords associated with the DebugLayer.
var _widget_keywords = {}
Next, we’ll add in the ability to “register” debug widgets to the DebugLayer.
func _ready():
  # ...existing code
  _register_debug_widgets(self)


# Go through all children of provided node and register any DebugWidgets found.
func _register_debug_widgets(node) -> void:
  for child in node.get_children():
    if child is DebugWidget:
      register_debug_widget(child)
    elif child.get_child_count() > 0:
      _register_debug_widgets(child)


# Register a single DebugWidget to the DebugLayer.
func register_debug_widget(widgetNode) -> void:
  for widget_keyword in widgetNode.get_widget_keywords():
    _add_widget_keyword(widget_keyword, widgetNode)
In our _ready() function, we’ll call _register_debug_widgets() on the DebugLayer root node. _register_debug_widgets() loops through the children of the passed-in node (which, during the ready function execution, is DebugLayer). If any children with the DebugWidget class are found, it’ll call register_debug_widget() to register it. Otherwise, if that child has children, then _register_debug_widgets() is called on that child, so that ultimately all the nodes in DebugLayer will be processed to ensure all debug widgets are found.
register_debug_widget(), meanwhile, is responsible for looping through the debug widget’s keywords (acquired from calling get_widget_keywords()) and adding them to the keywords dictionary via _add_widget_keyword(). Note that this function I chose to not mark as “private” (by leaving off the underscore prefix). There may be reason to allow external code to register a debug widget manually. Though I personally haven’t encountered this scenario yet, the possibility seems plausible enough that I decided to not indicate the function as private.
Let’s add the _add_widget_keyword() function now:
# Adds a widget keyword to the registry.
func _add_widget_keyword(widget_keyword: String, widget_node: Node) -> void:
  var widget_node_name = widget_node.name if 'name' in widget_node else str(widget_node)

  if not _widget_keywords.has(widget_node_name):
    _widget_keywords[widget_node_name] = {}

  if not _widget_keywords[widget_node_name].has(widget_keyword):
    _widget_keywords[widget_node_name][widget_keyword] = widget_node
  else:
    var widget = _widget_keywords[widget_node_name][widget_keyword]
    var widget_name = widget.name if 'name' in widget else str(widget)
    push_error('DebugLayer._add_widget_keyword(): Widget keyword "' + widget_node_name + '.' + widget_keyword + '" already exists (' + widget_name + ')')
    return
That looks like a lot of code, but if you examine it closely, you’ll see that most of that code is just validating that the widget data we’re working with was set up correctly. First, we get the name of widget_node (aka the name as entered in the Godot editor). If that node’s name isn’t already a key in our _widget_keywords dictionary, we add it. Next, we check to see if the widget_keyword already exists in the dictionary. If it doesn’t, then we add it, setting the value equal to the widget node. If it does exist, we push an error to Godot’s error console (after some string construction to make a developer-friendly message).
Interacting with Debug Widgets
At this point, we can register debug widgets so that our debugging system is aware of them, but we still don’t have a means of communicating with the debug widgets. Let’s take care of that now.
# Sends data to the widget with widget_name, triggering the callback for widget_keyword.
func update_widget(widget_path: String, data) -> void:
  var split_widget_path = widget_path.split('.')
  if split_widget_path.size() == 1 or split_widget_path.size() > 2:
    push_error('DebugContainer.update_widget(): widget_path formatted incorrectly. ("' + widget_path + '")')

  var widget_name = split_widget_path[0]
  var widget_keyword = split_widget_path[1]

  if _widget_keywords.has(widget_name) and _widget_keywords[widget_name].has(widget_keyword):
    _widget_keywords[widget_name][widget_keyword].handle_callback(widget_keyword, data)
  else:
    push_error('DebugContainer.update_widget(): Widget name and keyword "' + widget_name + '.' + widget_keyword  + '" not found (' + str(_widget_keywords) + ')')
Our API to interact with debug widgets will work like this: we’ll pass in a widget_path string to update_widget(), split with a . delimiter. The first half of the widget_path string is the name of the widget we want to send data to; the second half is the widget keyword we want to invoke (and thereby tell the widget what code to run).
update_widget() performs string magic on our widget_path, makes sure that we sent in a properly-formatted string and that the widget and widget keyword is part of _widget_keywords. If things were sent correctly, the widget node reference we stored during registration is accessed, and the handle_callback() method called, passing in whatever data the widget node expects. If something’s not done correctly, we alert the developer with error messages and return without invoking anything.
That’s all we need to talk to debug widgets. Let’s make a test to verify that everything works!
Currently, our TestScene scene doesn’t have an attached script. Go ahead and attach one now (calling it TestScene.gd) and add the following code to it:
This is just a simple counter functionality, where test_ct is incremented by 1 each process step. Between 0-899, Debug.update_widget() will be called, targeting a debug widget named “TextList1” and the add_widget widget keyword. For the data we’re passing the widget, we send the name of the label we want to update, and the value to update to (which is a string version of test_ct). Once test_ct hits 900, however, we want to remove the label from the debug widget, which we accomplish through another Debug.update_widget() call to TextList1, but this time using the remove_label widget keyword. Finally, once test_ct hits 1000, we reset it to 0 so it can begin counting up anew.
If you run the test scene right now, though, nothing happens. Why? We haven’t added TextList1 yet! To do that, go to the DebugLayer scene, remove the existing test label (that we created during Part 1), and instance a DebugTextList child, naming it TextList1. Now, if you run the test scene and open up the debugging interface (with Shift + `, which we set up in the previous part), you should be able to see our debug widget, faithfully reporting the value of test_ct each process step.
If that’s what you see, congratulations! If not, review the tutorial code samples and try to figure out what might’ve been missed.
One More Thing
There’s an issue that we’re not going to run into as part of this tutorial series, but that I’ve encountered during my own personal use of this debugging system. To save future pain and misery, we’re going to take care of that now.
Currently, our code for debug widgets always assumes that we’re going to pass in some form of data for it to process. But what if we want a debug widget that doesn’t need additional data? As things stand, because debug widgets assume that there will be data, the code will crash if you don’t pass in any data.
To fix that, we’ll need to add a couple of things to the base DebugWidget class:
# Controls if the widget should allow invocation without data.
export(bool) var allow_null_data = false


# Called by DebugContainer when one of its widget keywords has been invoked.
func handle_callback(widget_keyword: String, data = null) -> void:
  if data == null and not allow_null_data:
    push_error('DebugWidget.handle_callback(): data is null. (' + widget_keyword + ')')
    return

  _callback(widget_keyword, data)
We’ve added an exported property, allow_null_data, defaulting it to false. If a debug widget implementation wants to allow null data, it needs to set this value to true.
handle_callback() has also been modified. Before it runs _callback(), it first checks to see if data is null (which it will be if the second argument isn’t provided, because we changed the argument to default to null). If data is null, and we didn’t allow that, we push an error and return without running callback(). That prevents the game code crashing because of null data, and it also provides helpful information to the developer. If there is data, or the debug widget explicitly wants to allow null data, then we run _callback(), as normal.
That should take care of the null data issue. At this point, we’re golden!
Congratulations!
Our debugging system now supports adding debug widgets, and through extending the base DebugWidget class we can create whatever data displays we want. DebugTextList was the first one we added, and hopefully it should be easy to see how simple it is to add other debug widgets that show our debugging information in whatever ways we want. If we want to show more than one debug widget, no problem, just instance another debug widget!
Even though all this is pretty good, there are some flaws that might not be immediately apparent. For instance, what happens if we want to implement debug widgets that we don’t want to be shown at the same time, such as information about different entities in our game? Or what if we want to keep track of so much debugging information that we clutter the screen, making it that much harder to process what’s going on?
Wouldn’t it be nice if we could have multiple debug scenes that we could switch between at will when the debug interface is active? Maybe we’d call these scenes “containers”. Or, even better, a DebugContainer.
That’s what we’ll be building in the next part of this tutorial!
If you want to see the complete results from this part of the tutorial, check the tutorial-part-2 branch of the Github repo.
At some point during the development of a game, you need to be able to show information that helps you debug issues in your game. What kind of information? That really depends on your game and what your needs are. It could be as simple as printing some text that shows the result of an internal calculation, or it could be as fancy as a chart showing the ratio of decisions being made by the game’s artificial intelligence.
There are different kinds of debugging needed as well. Sometimes, you need something temporary to help you figure out why that function you just wrote isn’t behaving the way you expect it to. Other times, you want an “official” debugging instrument that lives on as a permanent display in your game’s debugging interface.
How does one go about building a debugging system, however? In this blog tutorial, we’ll build a debugging system in the Godot game engine, one that is flexible, yet powerful. It’s useful both for temporary debugging and a long-term debugging solution. I use this system to provide a debugging interface for my own games, and I want to share how to make one like it in the hopes that it helps you in your own game development efforts.
This will be a multiple-part series. At the end of it, you’ll have the root implementation of the debugging system, and knowledge on how to extend it to suit your debugging purposes.
Godot comes with a number of functionalities that are useful for debugging. The most obvious of these is the trusty print() function. Feed it a string, and that string will get printed out to the debugging console during game runtime. Even when you have a debugging system in place, print() is still useful as part of your toolset for temporary debugging solutions. That said, nothing you show with print() is exposed to an in-game interface, so it’s not very useful if you want to show debugging information on a more permanent basis. Also, if you need to see information that updates on every frame step, the debugging console will quickly be overwhelmed with a flood of printed messages, to the point where Godot will bark at you about printing too many messages. Thus, while print() definitely has its uses, we are still in need of something more robust for long-term debugging solutions.
One way I solved this problem in the past is by creating a DebugLabel node, based on a simple Label. This node would listen for a signal, and when said signal was received it would set its text value to whatever string was sent to it. The code looked something like this:
This solution also depended on a separate GlobalMessenger system that functions as a global way of passing information. But that system is a tale for another day.
This gave me a solution for printing debugging information that updated on every process step, without overloading the debugging console. While this little component was useful, it had its drawbacks. Every call to print a message to the DebugLabel would overwrite the previous value, so if I needed to show more than one piece of updating information, I would have to create multiple DebugLabel nodes. It wouldn’t take long for my scenes to be cluttered with DebugLabel nodes. Also, this still wasn’t part of a debugging system. If there was a DebugLabel, it’d show, regardless of whether you needed to view debugging information or not. Thus, while this node also served a valuable purpose, it was not enough for a proper debugging solution.
So what does a debugging solution need? It needs a way to conditionally show and hide debugging information, depending on whether such information needs to be viewed. It also needs to expose a method for game code to interact with it to pass in debugging information. There are many possible kinds of information that we’d want to see, so this interaction method must support being able to accept multiple kinds of information. Finally, there should be an easy way of creating debugging scenes to organize the information in whatever ways make sense to those that view the debugging information.
With that high-level information, let’s start by tackling the first part of that paragraph: conditionally showing and hiding the debugging information.
Creating a Test Scene
But before we start working on the debugging system proper, we should have a test scene that exists to help us test that what we’re creating actually works. It doesn’t need to be anything fancy.
While this part of the tutorial is optional, the tutorial series will be assuming the existence of this test scene. If you choose not to make it, then you’ll have to figure out how to test the debugging system’s code in a different way.
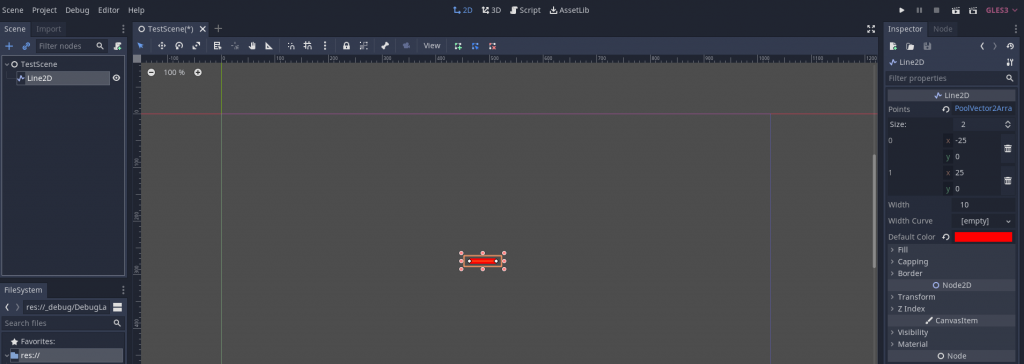
Create a scene, and have it extend Node. Let’s call it “TestScene”. In TestScene, add a Line2D node, make it whatever color you want (I chose red), and set the points to make it some easily-visible size (I set mine to [-25, 0], [25, 0] to make a 50px-long horizontal line). Move the Line2D somewhere near the center of the scene; it doesn’t have to be exact, as long as it isn’t too close to the top or edge of the game window. Finally, click the triangle button to run Godot’s main scene; since we don’t have one defined, Godot will pop up an interface that will allow you to make TestScene the default scene, which you should do.
You can alternatively just run this individual scene without making it the main scene; I have chosen to make it the main scene in this tutorial purely out of convenience.
This is what my version of the test scene looks like after doing these things:
Now that we have a test scene, let’s get to building the debugging system proper.
Creating the DebugLayer Global
We need a way to interact with the debugging interface from anywhere in our game code. The most effective way to do this is to create a global scene that it loaded as part of the AutoLoads. This way, any time our game or a scene in our game is run, the debugging system will always be available.
Start by creating a new scene, called DebugLayer, and have it extend the CanvasLayer node. Once the scene is created, go to the CanvasLayer node properties and set the layer property to 128.
That layer property tells Godot what order it should render CanvasLayer nodes in. The highest value allowed for that property is 128, and since we want debugging information to be rendered atop all other information, that’s what we’ll set our DebugLayer to.
Now, create a script for our node, DebugLayer.gd. For now, we’re not going to add anything to it, we just want the script to be created. Make sure it, as well as the DebugLayer scene, are saved to the directory _debug (which doesn’t exist yet, so you’ll need to create it).
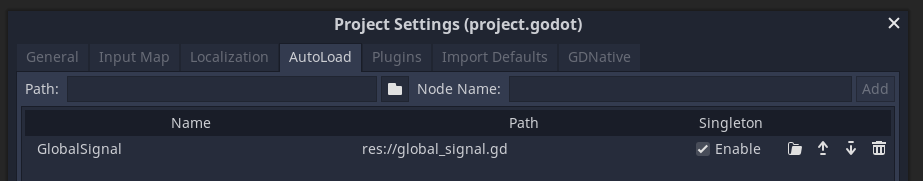
Finally, go to Project -> Project Settings -> AutoLoad, and add the DebugLayerscene (not the DebugLayer.gd script) as an AutoLoad, shortening its name to Debug in the process. This is how we’ll make our debugging interface accessible from all parts of our game.
Yes, you can add scenes to AutoLoad, not just scripts. I actually discovered that thanks to a GDQuest tutorial on their Quest system, and have since used that pattern for a wide variety of purposes, including my debugging system.
To verify that our DebugLayer shows in our game, add a Label child to the DebugLayer scene, then run the game. You should be able to see that Label when you run the game, proving that DebugLayer is being rendered over our TestScene.
Toggle Debug Visibility
This isn’t particularly useful yet, though. We want to control when we show the debugging information. A good way to do this is to designate a key (or combination of keys) that, when pressed, toggles the visibility of DebugLayer and any nodes it contains.
Open up the project settings again, and go to Input Map. In the textbox beside Action:, type “toggle_debug_interface” and press the Add button. Scrolling down to the bottom of the Input Map list will reveal our newly-added action at the bottom.
Now we need to assign some kind of input that will dispatch this toggle_debug_interface action. Clicking the + button will allow you to do this. For this tutorial, I’ve chosen to use Shift + ` as the combination of keys to press (Godot will show ` as QuoteLeft). Once this is done, go ahead and close the project settings window.
It’s time to start adding some code. Let’s go to DebugLayer.gd and add this code:
Right away, the editor will show an error on the visible = boolean line. You can confirm the error is valid by running the project and seeing the game crash on that line, with the error The identifier "visible" isn't declared in the current scope. That’s because CanvasLayer doesn’t inherit from the CanvasItem node, so it doesn’t contain a visible property. Therefore, we’ll need to add a node based on Control that acts as a UI container, and it is this node that we’ll toggle visibility for.
CanvasItem is the node all 2D and Control (aka UI) nodes inherit from.
Add a MarginContainer node to DebugLayer, calling it DebugUIContainer. Then, move the test label we created earlier to be a child of the DebugUIContainer. Finally, in DebugLayer.gd, change the visibility target to our new UI container:
onready var _uiContainer = $DebugUIContainer


func _set_ui_container_visibility(boolean):
  _uiContainer.visible = boolean
You may notice that I’m prefixing _uiContainer with an underscore. This is a generally-accepted Godot best practice for identifying class members that are intended to be private, and thus should not be accessed by code outside of that class. I also use camelCase to indicate that this particular variable represents a node. Both are my personal preferences, based on other best practices I’ve observed, and you do not need to adhere to this style of nomenclature for the code to work.
At this point, if you run the test scene, the test label that we’ve added should no longer be visible (because we’ve defaulted visibility to false). That’s only half the battle, of course; we still need to add the actual visibility toggling functionality. Let’s do so now:
func _input(_event):
  if Input.is_action_just_pressed('toggle_debug_interface'):
    show_debug_interface = !show_debug_interface
    _set_ui_container_visibility(show_debug_interface)
_input() is a function Godot runs whenever it detects an input action being dispatched. We’re using it to check if the input action is our toggle_debug_interface action (run in response to our debug key combination we defined earlier). If it is our toggle_debug_interface action, then we invert the value of show_debug_interface and call _set_ui_container_visibility with the new value.
Technically, we could just call the visibility function with the inverted value, but setting a variable exposes to outside code when the debug interface is being shown. While this tutorial is not going to show external code making use of that, it seems a useful enough functionality that we’re going to include it nonetheless.
Run the test scene again, and press Shift + `. This should now reveal our test label within DebugLayer, and prove that we can toggle the debug interface’s visibility. If that’s what happens, congratulations! If not, review the tutorial to try and identify what your implementation did incorrectly.
Congratulations!
We now have the basics of a debugging interface. Namely, we have a DebugLayer scene that will house our debugging information, one that we can make visible or invisible at the press of a couple of keys.
That said, we still don’t have a way of actually adding debugging information. As outlined earlier, we want to be able to implement debugging displays that we can easily reuse, with a simple API for our game code to send debugging information to the debugging system.
To accomplish these objectives, we’ll create something that I call “debug widgets”. How does a debug widget work? Find out in the next part of this tutorial!
You can review the end state of Part 1 in the Github repo by checking out the tutorial-part-1 branch.
If you’ve worked in Godot long enough, you’ll have encountered the signal pattern. This pattern has one part of the code providing signals that it emits, which other parts of the code can listen for and react to. It’s very useful for keeping the parts of your codebase separated by concern, thereby preventing explicit dependencies, while still allowing for communication between different systems. This pattern is commonly used with UI elements, which have no bearing on how the game systems work, but still need to know when certain events happen. With signals, the UI nodes can listen for when specific game events occur, then take the data from those signals and use it to update their visuals.
In Godot, this pattern is implemented through the use of a Node’s signal keyword, emit_signal and connect methods, and a callback function. Example follows:
# Some example node script
extends Node
signal an_awesome_signal

func an_awesome_function():
  emit_signal('an_awesome_signal', 'data that the listeners receive')

func another_awesome_function():
  connect('an_awesome_signal', self, '_on_An_awesome_signal')

func _on_An_awesome_signal(data):
  print(data) # 'data that the listeners receive'
It is considered good Godot practice to name your listener callbacks after the signal they are responding to, prefixed with _on_ and with the first letter of the signal name capitalized.
Of course, you don’t have to just connect to signals within your node. Any node that is in the same scene as another node can connect to that node’s signals and listen for them. As explained, connecting nodes to one another allows for coding systems that need to respond to certain game events, but without having to call externalNode.external_node_method() each time external_node_method needs to be run in response to something happening.
Godot’s signal implementation is great, but there is a caveat: it doesn’t provide a clean way to listen for nodes which exist outside of the current scene. Let’s go back to the UI example. UI nodes and their code are usually kept separate from game systems code (after all, game systems shouldn’t need to manage the UI), often by creating entire scenes which house a portion of some UI widget, like a health bar. But how does said health bar know when it needs to be updated? Given this health bar (let’s call it HealthBarUI) is separate from the systems which actually calculate an entity’s health, we can’t directly connect it to the health system.
One way to solve this problem is to use relative paths when connecting the signals, e.g. ../../../HealthBarUI. Obviously, this solution is very brittle. If you decide that HealthBarUI needs to be moved anywhere in the node tree, you’ll have to update the signal connection path accordingly. It’s not hard to imagine this becoming untenable when adding many nodes which are connected to other nodes outside of their scene tree; it’s a maintenance nightmare.
A better solution would be to create a global singleton which your nodes can connect to, instead, adding it to the global AutoLoads. This alleviates the burden of relative paths by providing a global singleton variable that is guaranteed to be accessible from every scene.
Many programmers will advise against using the Singleton pattern, as creating so-called “god objects” is an easy way to create messy, disorganized code that makes code reuse more difficult. I share this concern, but advocate that there are certain times where you want to have a global singleton, and I consider this one of them. As with all practices and patterns, use your best judgment when it comes to determining how to apply them to solve your systems design problems.
GDQuest gives a good example of this pattern in this article. Basically, for every signal which needs to be globally connected, you add that signal definition to the global singleton, connect your local nodes to the singleton, and call Singleton.emit_signal() whenever you need to emit the global version of that signal. While this pattern works, it obviously gets more complex with each signal that you need to add. It also creates a hard dependency on the singleton, which makes it harder to reuse your nodes in other places without the global singleton.
I would like to propose a different take on the global singleton solution. Instead of explicitly defining global signals inside of a globally-accessible singleton file, we can dynamically add signals and connectors to a GlobalSignal node through add_emitter and add_listener methods. Once a signal is registered, then whenever it is emitted by its node, any registered listeners of that signal will receive it and be able to respond to it, exactly the same as how signals normally work. We avoid a hard dependency on the GlobalSignal singleton because we’re just emitting signals the normal way. It’s a clean solution that takes advantage of how Godot’s signals work as much as possible.
Also, this post was originally written for Godot 3.x. With Godot 4.0 being (finally) released, I did a quick conversion of the sample project to 4.0 and pushed it up in a separate branch. I won’t update the article with 4.0 versions of code at this time, but there aren’t too many changes, so it shouldn’t be too hard to follow and translate the differences.
Building the Basics
Let’s start by creating the file (I’m assuming you’ll have created a Godot project to work with, first). I’ve called it global_signal.gd. It should extend the basic Node. Once the file is created, we should add it to the global AutoLoads by going into Godot’s project settings, clicking the AutoLoad tab, then adding our script (with the variable name GlobalSignal).
This is how we will make GlobalSignal accessible from any scene’s code. Godot automatically loads any scripts in the AutoLoad section first and places them at the top of the game’s node hierarchy, where they can be accessed by their name.
With that out of the way, let’s start adding code to global_signal.gd. First, we need a way for GlobalSignal to know when a node has a signal that can be emitted globally. Let’s call these nodes emitters. This code should take care of adding emitters for GlobalSignal to keep track of:
# Keeps track of what signal emitters have been registered.
var _emitters = {}


# Register a signal with GlobalSignal, making it accessible to global listeners.
func add_emitter(signal_name: String, emitter: Object) -> void:
  var emitter_data = { 'object': emitter, 'object_id': emitter.get_instance_id() }
  if not _emitters.has(signal_name):
    _emitters[signal_name] = {}
  _emitters[signal_name][emitter.get_instance_id()] = emitter_data
Nothing too complex about this. We create a dictionary to store data for the emitter being added, check to see if we have an existing place to store signals with this name (and create a new dictionary to house them if not), then add it to the _emitters dictionary, storing it by signal name and instance id (the latter being a guaranteed unique key that is already part of the node, something we’ll be taking advantage of later).
We can now register emitters, but we also need a way to register listener nodes. After all, what’s the point of having a global signal if nothing can respond to it? The code for adding listeners is nearly identical to the code for adding emitters; we’re just storing things in a _listeners variable instead of _emitters.
# Keeps track of what listeners have been registered.
var _listeners = {}

# Adds a new global listener.
func add_listener(signal_name: String, listener: Object, method: String) -> void:
  var listener_data = { 'object': listener, 'object_id': listener.get_instance_id(), 'method': method }
  if not _listeners.has(signal_name):
    _listeners[signal_name] = {}
  _listeners[signal_name][listener.get_instance_id()] = listener_data
With that, we now have the ability to add emitters and listeners. What we don’t yet possess is a way to connect these emitters and listeners together. Normally, when using signals, we’d have the listener node connect() to the emitter node, specifying whatever signal it wants to connect to and the callback function which should be invoked (as well as the node where this callback function resides). We need to replicate this functionality here, but how do we ensure that a new emitter gets connected to all current and future listeners, and vice versa?
Simply put, every time we add a new emitter, we need to loop through GlobalSignal‘s listeners, find the ones which want to connect with that emitter’s signal, and perform the connection. The same is true for when we add a new listener: when a new listener is added, we need to loop through the registered emitters, find the ones whose signal matches the one the listener wants to listen to, and perform the connection. To abstract this process, let’s create a couple of functions to take care of this for us.
# Connect an emitter to existing listeners of its signal.
func _connect_emitter_to_listeners(signal_name: String, emitter: Object) -> void:
  var listeners = _listeners[signal_name]
  for listener in listeners.values():
    emitter.connect(signal_name, listener.object, listener.method)


# Connect a listener to emitters who emit the signal it's listening for.
func _connect_listener_to_emitters(signal_name: String, listener: Object, method: String) -> void:
  var emitters = _emitters[signal_name]
  for emitter in emitters.values():
    emitter.object.connect(signal_name, listener, method)
Now we need to modify our existing add functions to run these connector functions.
We first check to make sure an emitter/listener has already been defined before we try to connect to it. Godot doesn’t like it when you try to run code on objects that don’t exist. 😛
With that, the last thing we need to finish the basic implementation is to add a way for removing emitters and listeners when they no longer need to be connected. We can implement such functionality thusly:
# Remove registered emitter and disconnect any listeners connected to it.
func remove_emitter(signal_name: String, emitter: Object) -> void:
  if not _emitters.has(signal_name): return
  if not _emitters[signal_name].has(emitter.get_instance_id()): return

  _emitters[signal_name].erase(emitter.get_instance_id())

  if _listeners.has(signal_name):
    for listener in _listeners[signal_name].values():
      if emitter.is_connected(signal_name, listener.object, listener.method):
        emitter.disconnect(signal_name, listener.object, listener.method)


# Remove registered listener and disconnect it from any emitters it was listening to.
func remove_listener(signal_name: String, listener: Object, method: String) -> void:
  if not _listeners.has(signal_name): return
  if not _listeners[signal_name].has(listener.get_instance_id()): return

  _listeners[signal_name].erase(listener.get_instance_id())

  if _emitters.has(signal_name):
    for emitter in _emitters[signal_name].values():
      if emitter.object.is_connected(signal_name, listener, method):
        emitter.object.disconnect(signal_name, listener, method)
As with the add functions, the remove functions are both almost identical. We take an emitter (or listener), verify that it exists in our stored collection, and erase it from the collection. After that, we check to see if anything was connected to the thing being removed, and if so we go through all such connections and remove them.
That’s it for the basic implementation! We now have a functional GlobalSignal singleton that we can use to connect emitters and listeners dynamically, whenever we need to.
A Simple Test
Let’s create a simple test to verify that all this is working as intended.
First, create a Node-based scene in your project. Then, add a LineEdit node and a Label node (along with whatever other Control nodes you want to add to make it appear the way you want), and create the following scripts to attach to them:
You could also use the value argument for _on_Text_changed, instead of taking the direct value of text. It’s a matter of preference.
Assuming you’ve implemented the code from this tutorial correctly, when you run the scene, you should be able to type in the LineEdit node and see the values of the Label node update automatically. If it’s working, congratulations! If not, go back and look through the code samples to see what you might’ve missed, or download the sample project to compare it with yours.
Now, obviously, this is a contrived example. GlobalSignal would be overkill for solving such a simple scenario as the one presented in the test case. Hopefully, though, it illustrates how this approach would be useful for more complex scenarios, such as the HealthBarUI example described earlier. By making our global signal definition dynamic, we avoid having to make updates to GlobalSignal every time we need to add a new globally-accessible signal. We emit signals from the nodes, as you do normally; we just added a way for that signal to be listened to by nodes outside of the node’s scene tree. It’s powerful, flexible, and clean.
Resolving Edge Cases and Bugs
There are some hidden issues that we need to address, however. Let’s take a look at them and see how we can fix them.
Dealing with Destroyed Nodes
Let’s ask ourselves a hypothetical question: what would happen if a registered emitter or listener is destroyed? Say the node is freed by the parent (or the parent itself is freed). Would GlobalSignal know this node no longer exists? The answer is no, it wouldn’t. Subsequently, what would happen if we’re looping through our registered emitters/listeners and we try to access the destroyed node? Godot gets unhappy with us, and crashes.
How do we fix this? There are two approaches we could take:
We could poll our dictionaries of registered emitters and listeners every so often (say, once a second) to check and see if there’s any dead nodes, and remove any we find.
Alternatively, we could run that same check and destroy whenever we make a call to a function which needs to loop through the lists of emitters and listeners.
Of those two options, I prefer the latter. By only running the check when we explicitly need to loop through our emitters and listeners, we avoid needlessly running the check and thereby introducing additional processing time when we don’t know that it’s necessary (which is what would happen if we went with polling). Thus, we’re going to implement this only-when-necessary check in the four places that need it: namely, whenever we add or remove an emitter or listener.
There is an argument to be made that running the check as part of adding/removing emitters/listeners adds additional processing time when performing these functions. That’s true, but in practice I’ve found that the added time isn’t noticeable. That said, if your game is constantly creating and destroying nodes that need to be globally listened to, and it’s measurably impacting game performance, it may prove better to implement a poll-based solution. I’m just not going to do it as part of this tutorial.
First, let’s create a function that will both perform the check and remove the emitter/listener if it is determined it no longer exists.
# Checks stored listener or emitter data to see if it should be removed from its group, and purges if so.
# Returns true if the listener or emitter was purged, and false if it wasn't.
func _process_purge(data: Dictionary, group: Dictionary) -> bool:
  var object_exists = !!weakref(data.object).get_ref() and is_instance_valid(data.object)

  if !object_exists or data.object.get_instance_id() != data.object_id:
    group.erase(data.object_id)
    return true
  return false
First, we check all the possible ways that indicate that a node (or object, which is what a node is based on) no longer exists. weakref() checks to see if the object only exists by reference (aka has been destroyed and is pending removal from memory), and is_instance_valid is a built in Godot method that returns whether Godot thinks the instance no longer exists. I’ve found that I’ve needed both checks to verify whether or not the object truly exists.
You may want to abstract this object existence check into some kind of helper function that is made globally accessible. This is what I’ve done in my own implementation of GlobalSignal, but I chose to include it directly in this tutorial to avoid having to create another file exclusively to house that helper.
Even if we prove the object exists, we still need to check to make sure the stored instance id for the emitter/listener matches the current instance id of said object. If they don’t match, then it means the stored object is no longer the same as the one we registered (aka the reference to it changed).
If the object doesn’t exist, or if it’s not the same object as the one we registered, then we need to remove it from our dictionary. group is the collection we passed in for validation (this will be explained in more detail momentarily), and group.erase(data.object_id) deletes whatever value is stored at the key with the same name as data.object_id. If we’ve reached this point, we then return true. If we didn’t erase the object, we return false.
With our purge function defined, let’s go ahead and modify our add and remove functions to implement it:
func _connect_emitter_to_listeners(signal_name: String, emitter: Object) -> void:
  var listeners = _listeners[signal_name]
  for listener in listeners.values():
    if _process_purge(listener, listeners):
      continue
    emitter.connect(signal_name, listener.object, listener.method)


func _connect_listener_to_emitters(signal_name: String, listener: Object, method: String) -> void:
  var emitters = _emitters[signal_name]
  for emitter in emitters.values():
    if _process_purge(emitter, emitters):
      continue
    emitter.object.connect(signal_name, listener, method)


func remove_emitter(signal_name: String, emitter: Object) -> void:
  # ...existing code

  if _listeners.has(signal_name):
    for listener in _listeners[signal_name].values():
      if _process_purge(listener, _listeners[signal_name]):
        continue
      if emitter.is_connected(signal_name, listener.object, listener.method):
        emitter.disconnect(signal_name, listener.object, listener.method)


func remove_listener(signal_name: String, listener: Object, method: String) -> void:
  # ...existing code

  if _emitters.has(signal_name):
    for emitter in _emitters[signal_name].values():
      if _process_purge(emitter, _emitters[signal_name]):
        continue
      if emitter.object.is_connected(signal_name, listener, method):
        emitter.object.disconnect(signal_name, listener, method)
For each function, the only thing we’ve changed is adding the _process_purge() check before doing anything else with the emitters/listeners. Let’s examine what’s happening in _connect_emitter_to_listeners(), to detail the logic.
As we start looping through our dictionary of listeners (grouped by signal_name), we first call _process_purge(listener, listeners) in an if statement. From examining the code, listener is the current listener node (aka the object we want to verify exists) and listeners is the group of listeners for a particular signal_name. If _process_purge() returns true, that means the listener did not exist, so we continue to move on to the next stored listener. If _process_purge() returns false, then the listener does exist, and we can proceed with connecting the emitter to the listener.
The same thing happens for the other three functions, just with different values passed into _process_purge(), so I shan’t dissect them further. Hopefully, the examination of what happens in _connect_emitter_to_listeners() should make it clear how things work.
That’s one issue down. Let’s move on to the last issue that needs to be addressed before we can declare GlobalSignal complete.
Accessing an Emitter/Listener Before It’s Ready
Here’s another scenario to consider: what happens if we want to emit a globally-accessible signal during the _ready() call? You can try this out yourself by adding this line of code to TestLineEdit.gd, right after defining the global signal:
GlobalSignal.add_emitter('text_updated', self)
emit_signal('text_updated', 'text in _ready()')
We’d expect that, on starting our scene, our Label node should have the text set to “text in _ready()”. In practice, however, nothing happens. Why, though? We’ve established that we can use GlobalSignal to listen for nodes, so why doesn’t the connection in Label seem to be working?
To answer this question, let’s talk a little about Godot’s initialization process. When a scene is added to a scene tree (whether that be the root scene tree or a parent’s scene tree), the _ready() function is called on the lowermost child nodes, followed by the _ready() functions of the parents of those children, and so on and so forth. For sibling children (aka child nodes sharing the same parent), Godot calls them in tree order; in other words, Child 1 runs before Child 2. In our scene tree composition for the sample project, the LineEdit node comes before the Label node, which means the _ready() function in LineEdit runs first. Since Label is registering the global listener in its _ready() function, and that function is running after LineEdit‘s _ready() function, our text_updated signal gets emitted before the listener in Label is registered. In other words, the signal is being emitted too early.
How do we fix this? In our contrived example, we could move the Label to appear before the LineEdit, but then that changes where the two nodes are being rendered. Besides, basing things on _ready() order isn’t ideal. In the case where we want nodes in different scenes to listen for their signals, we can hardly keep track of when those nodes run their _ready() function, at least not without some complex mapping of your scene hierarchy that is painful to maintain.
The best to solve this problem is to provide some way to guarantee that, when emit_signal is called, that both the emitter and any listeners of it are ready to go. We’ll do this by adding a function called emit_signal_when_ready() which we call whenever we need to emit a signal and guarantee that any listeners for it that have been defined in _ready() functions are registered.
Unfortunately, we can’t override the existing emit_signal function itself to do this, because emit_signal uses variadic arguments (aka the ability to define any number of arguments to the function), which is something Godot does not allow for user-created functions. Therefore, we need to create a separate function for this.
We’ll need to add more than just the emit_signal_when_ready() function itself to make this functionality work, so I’ll go ahead and show all of the code which needs to be added, and then cover what’s going on in detail.
# Queue used for signals emitted with emit_signal_when_ready.
var _emit_queue = []

# Is false until after _ready() has been run.
var _gs_ready = false


# We only run this once, to process the _emit_queue. We disable processing afterwards.
func _process(_delta):
  if not _gs_ready:
    _make_ready()
    set_process(false)
    set_physics_process(false)


# Execute the ready process and initiate processing the emit queue.
func _make_ready() -> void:
  _gs_ready = true
  _process_emit_queue()


# Emits any queued signal emissions, then clears the emit queue.
func _process_emit_queue() -> void:
  for emitted_signal in _emit_queue:
    emitted_signal.args.push_front(emitted_signal.signal_name)
    emitted_signal.emitter.callv('emit_signal', emitted_signal.args)
  _emit_queue = []


# A variant of emit_signal that defers emitting the signal until the first physics process step.
# Useful when you want to emit a global signal during a _ready function and guarantee the emitter and listener are ready.
func emit_signal_when_ready(signal_name: String, args: Array, emitter: Object) -> void:
  if not _emitters.has(signal_name):
    push_error('GlobalSignal.emit_signal_when_ready: Signal is not registered with GlobalSignal (' + signal_name + ').')
    return

  if not _gs_ready:
    _emit_queue.push_back({ 'signal_name': signal_name, 'args': args, 'emitter': emitter })
  else:
    # GlobalSignal is ready, so just call emit_signal with the provided args.
    args.push_front(signal_name)
    emitter.callv('emit_signal', args)
That’s quite a lot to take in, so let’s break it down, starting with the two class members being added, _emit_queue and _gs_ready.
_emit_queue is a simple array that we’re going to use to keep track of any signals that have been marked as needing to be emitted when GlobalSignal decides everything is ready to go. _gs_ready is a variable that will be used to communicate when GlobalSignal considers everything ready.
I use _gs_ready instead of _ready to avoid giving a variable the same name as a class function. While I’ve found that Godot does allow you to do that, I consider it bad practice to have variables with the same name as functions; it’s confusing, and confusing code is hard to understand.
Next, let’s examine our call to _process() (a built-in Godot process that runs on every frame update):
# We only run this once, to process the _emit_queue. We disable processing afterwards.
func _process(_delta):
  if not _gs_ready:
    _make_ready()
    set_process(false)
    set_physics_process(false)
If _gs_ready is false (which is what we’ve defaulted it to), then we call _make_ready() and subsequently disable the process and physics process update steps. Since GlobalSignal doesn’t need to be run on updates, we can save processing time by disabling them once we’ve run _process() the first time. Additionally, since GlobalSignal is an AutoLoad, this _process() will be run shortly after the entire scene tree is loaded and ready to go.
Let’s check out what _make_ready() does:
# Execute the ready process and initiate processing the emit queue.
func _make_ready() -> void:
  _gs_ready = true
  _process_emit_queue()
The function sets _gs_ready to true, then calls _process_emit_queue(). By marking _gs_ready as true, it signals that GlobalSignal now considers things to be ready to go.
Moving on to _process_emit_queue():
# Emits any queued signal emissions, then clears the emit queue.
func _process_emit_queue() -> void:
  for emitted_signal in _emit_queue:
    emitted_signal.args.push_front(emitted_signal.signal_name)
    emitted_signal.emitter.callv('emit_signal', emitted_signal.args)
  _emit_queue = []
Here, we loop through the _emit_queue array, push the signal name to the front of the arguments array, and use callv to manually call the emit_signal() function on the emitter node, passing in the array of arguments (emit_signal() takes the signal’s name as the first argument, which is why we needed to make the signal name the first member of the arguments array) . When we’ve gone through all of the members of _emit_queue, we reset it to an empty array.
Finally, we come to the emit_signal_when_ready() function, itself:
# A variant of emit_signal that defers emitting the signal until the first process step.
# Useful when you want to emit a global signal during a _ready function and guarantee the emitter and listener are ready.
func emit_signal_when_ready(signal_name: String, args: Array, emitter: Object) -> void:
  if not _emitters.has(signal_name):
    push_error('GlobalSignal.emit_signal_when_ready: Signal is not registered with GlobalSignal (' + signal_name + ').')
    return

  if not _gs_ready:
    _emit_queue.push_back({ 'signal_name': signal_name, 'args': args, 'emitter': emitter })
  else:
    # GlobalSignal is ready, so just call emit_signal with the provided args.
    args.push_front(signal_name)
    emitter.callv('emit_signal', args)
First, we check to see if the signal we want to emit has been registered with GlobalSignal, and return early if it is not (with an error pushed to Godot’s console to tell us this scenario happened). Our next action depends on the value of _gs_ready. If it’s false (aka we aren’t ready), then we add a new entry to _emit_queue and pass in the signal name, arguments, and emitter node, all of which will be utilized during _process_emit_queue(). If it’s true, then we called this function after everything has been marked as ready; in that case, there’s no point in adding this to the emit queue, so we’ll just invoke emit_signal() and call it a day.
With that, GlobalSignal should now be able to handle dispatching signals and guaranteeing that the listeners defined during _ready() functions are registered. Let’s test this by changing our modification to TestLineEdit so it uses emit_signal_when_ready():
GlobalSignal.add_emitter('text_updated', self)
GlobalSignal.emit_signal_when_ready('text_updated', ['text in _ready()'], self)
Note that we need to convert our ‘text in _ready()’ argument to be wrapped in an array, since we need to pass an array of arguments to the function.
Also note that we have to pass in the emitter node, since we have to store that in order to call emit_signal() on it later.
If, when you run the scene, the Label node shows our text string, that means our changes worked! Now we can declare GlobalSignal done!
Using Global Signals
Congratulations! You now have a dynamic way to define globally-accessible signals that closely follows Godot’s natural signals implementation. Adding new global signals is easy, and doesn’t involve changing the GlobalSignal singleton at all.
At this point, you might wonder, “Why not convert all of my signals to be global signals?” That’s not necessarily a great idea. Most of the time, we want to keep our signals local, as when we start connecting code from disparate parts of our code base it can make it confusing to recall which things are connected to what. By keeping signals local whenever possible, we make dependencies clearer and make it harder to design bad code.
That’s one of the things I actually like about this approach to implementing global signals. We’re still emitting signals locally; we just choose which signals need to also be exposed globally. You can connect signals locally and globally, with the same signal definitions.
What are some good use cases? UI nodes, as mentioned before, are a great example of a good use case for this pattern. An achievements system needing to know when certain events occur is another possible use case. Generally, this pattern is best suited for when you have multiple “major” systems that need to talk to one another in an agnostic manner, while local signal connections are better for communication between the individual parts of a major system.
As with any pattern or best practice, GlobalSignal should be carefully considered as one of many solutions to your problem, and chosen if it proves to be the best fit.
One last time, here is the link to the sample project, if you didn’t build along with the tutorial, or just want something to compare your implementation against. (And if you are using Godot 4.0, here is the branch with that version of it!)
Hopefully, this approach to global signals helps you in your projects. I’ve certainly made great use of it in mine!
Recently, I decided to devote more time to writing blog posts, especially tutorials about things I’ve learned in my three-plus years of learning Godot and GDScript. When I went to write my first tutorial post, however, I discovered that there is no support for GDScript syntax highlighting in any of the code formatting plugins for WordPress. On top of that, Github’s Gists, which I’ve used to show syntax-highlighted code in the past, also does not support GDScript.
Syntax highlighting, for those who don’t know, is the colorful text and different font weights and decorations (aka bolded, italicized, and underlined text) that code editors show to indicate different functionalities of code. Using syntax highlighting to show what your code is doing is extremely helpful, if not critically important for making your code readable. Without syntax highlighting, it’s a lot more difficult to parse what a given block of code is doing, to the point where it feels unreadable. For tutorials, it’s especially important to make code as easy to understand as possible, and a critical part of that is including syntax highlighting.
Imagine trying to read a blog article where all the code samples were one giant block of monochromatic text, like this:
It’s a little tricky, isn’t it? Maybe you can read this particular example after a few moments, but what about 20-50 line examples of complex code? And what if you’re scanning back and forth between code samples, trying to parse how the whole thing works? It was clear to me that, if I wanted to write tutorials that were user-friendly, I needed to find a way to add support for GDScript syntax highlighting to my website.
After asking in the Godot Discord, I was pointed towards an implementation of GDScript in highlight.js, a JavaScript-based syntax highlighter. Some additional googling showed me how I could integrate highlight.js onto a website, and further research showed how to make changes to a WordPress website’s head file. Combining this information together, I was able to successfully integrate highlight.js and the GDscript extension for it onto my blog.
First, I went to Appearance -> Theme Editor and edited the header.php file, adding this snippet right below the wp_head() function call, to take care of downloading highlight.js:
Next, I went to the Github repo for hilightjs-gdscript and copied the contents of the gdscript.min.js file, adding it just below where I added the main highlight.js script tag:
<!-- Syntax highlighting for GDScript. -->
<script>hljs.registerLanguage("gdscript",function(){"use strict";var e=e||{};function r(e){return{aliases:["godot","gdscript"],keywords:{keyword:"and in not or self void as assert breakpoint class class_name extends is func setget signal tool yield const enum export onready static var break continue if elif else for pass return match while remote sync master puppet remotesync mastersync puppetsync",built_in:"Color8 ColorN abs acos asin atan atan2 bytes2var cartesian2polar ceil char clamp convert cos cosh db2linear decimals dectime deg2rad dict2inst ease exp floor fmod fposmod funcref get_stack hash inst2dict instance_from_id inverse_lerp is_equal_approx is_inf is_instance_valid is_nan is_zero_approx len lerp lerp_angle linear2db load log max min move_toward nearest_po2 ord parse_json polar2cartesian posmod pow preload print_stack push_error push_warning rad2deg rand_range rand_seed randf randi randomize range_lerp round seed sign sin sinh smoothstep sqrt step_decimals stepify str str2var tan tanh to_json type_exists typeof validate_json var2bytes var2str weakref wrapf wrapi bool int float String NodePath Vector2 Rect2 Transform2D Vector3 Rect3 Plane Quat Basis Transform Color RID Object NodePath Dictionary Array PoolByteArray PoolIntArray PoolRealArray PoolStringArray PoolVector2Array PoolVector3Array PoolColorArray",literal:"true false null"},contains:[e.NUMBER_MODE,e.HASH_COMMENT_MODE,{className:"comment",begin:/"""/,end:/"""/},e.QUOTE_STRING_MODE,{variants:[{className:"function",beginKeywords:"func"},{className:"class",beginKeywords:"class"}],end:/:/,contains:[e.UNDERSCORE_TITLE_MODE]}]}}return e.exports=function(e){e.registerLanguage("gdscript",r)},e.exports.definer=r,e.exports.definer||e.exports}());</script>
Imagine trying to read the above without syntax highlighting!
Finally, I added a call to initiate highlight.js, right below the highlightjs-gdscript code:
<script>hljs.highlightAll();</script>
And with that (omitting some trial and error on my part to figure out the above), I successfully got highlight.js to run on my WordPress blog, with syntax highlighting for GDscript!
I wasn’t happy with the out-of-the-box highlighting, though, so I decided to quickly throw together some custom styles, targeting the classes highlight.js injects. First, I went to Appearance -> Edit CSS in the WordPress menu settings and injected this CSS styling:
I also made changes to other parts of the highlight.js syntax highlighting that weren’t for GDScript to make them work with my new color scheme.
I also noticed that highlight.js wasn’t consistently auto-detecting when I was using GDScript, so I converted my WordPress code block to an HTML block and created the code tags manually:
Finally, highlightjs-gdscript didn’t include support for print, so I quickly added that to my import of the dist file:
{ keyword:"and in not or self void as assert breakpoint class class_name extends is func setget signal tool yield const enum export onready static var break continue if elif else for pass return match while remote sync master puppet remotesync mastersync puppetsync print" }
The final result looks like this:
At least, that’s what it looked like at the time I wrote this blog post. Since I was just looking to throw something together quickly, I didn’t put too much thought into my color scheme, instead utilizing a randomly-generated color palette (https://coolors.co/a63446-fbfef9-0c6291-000004-7e1946) and some hue-shifting to get related colors that weren’t part of the generated palette. Below is what the syntax highlight looks like on today’s iteration of the color scheme:
func ready():
  var variable = some_function()
  print("Hopefully this syntax highlighting works!")
Anyway, that’s a quick overview on how I implemented GDScript syntax highlighting on a WordPress blog. I imagine much of this can be adapted to implement GDScript syntax highlighting on any site. Now, on to writing blog posts!