How Donkey Kong Country 2’s Movement Feels Amazing (Part 1)

This is Part 1 of a 3-part series. Check out all the parts here!
Part 1: This post.
Part 2: Here!
Part 3: Here!

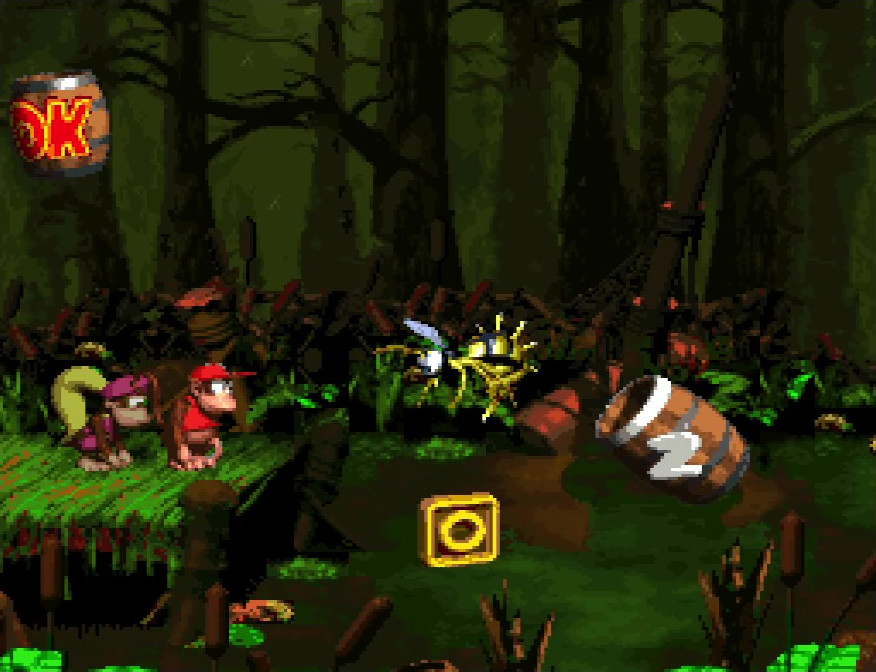
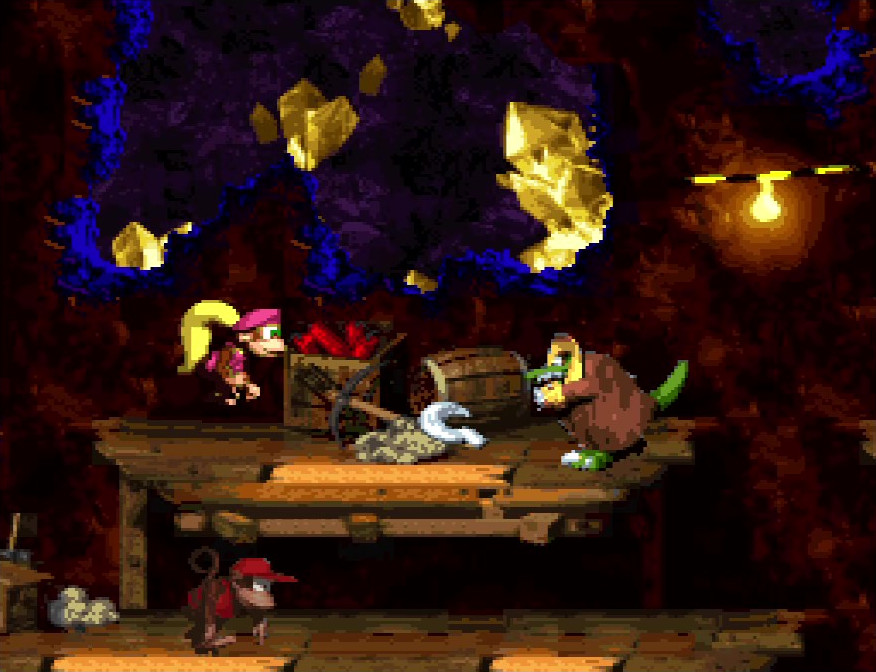
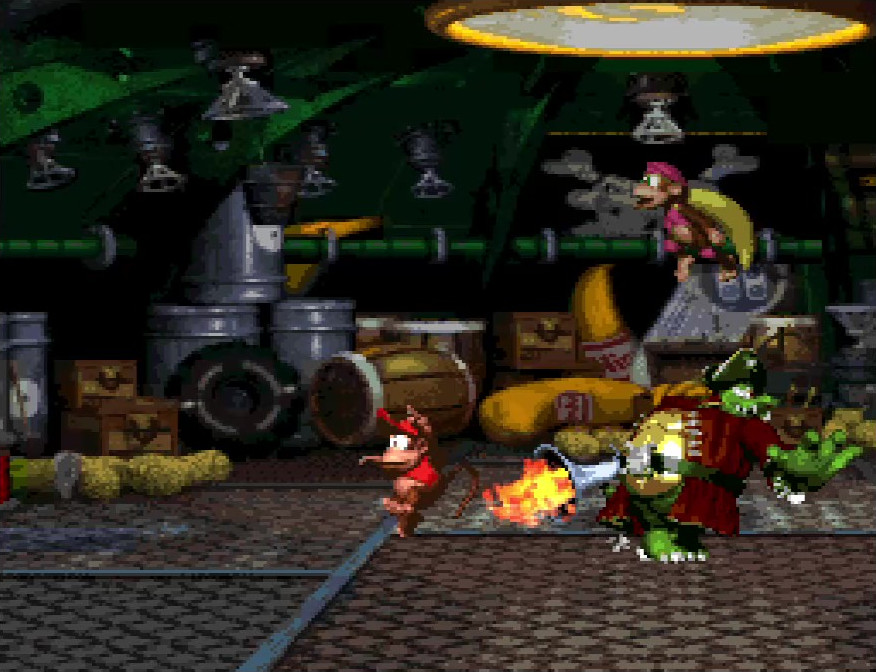
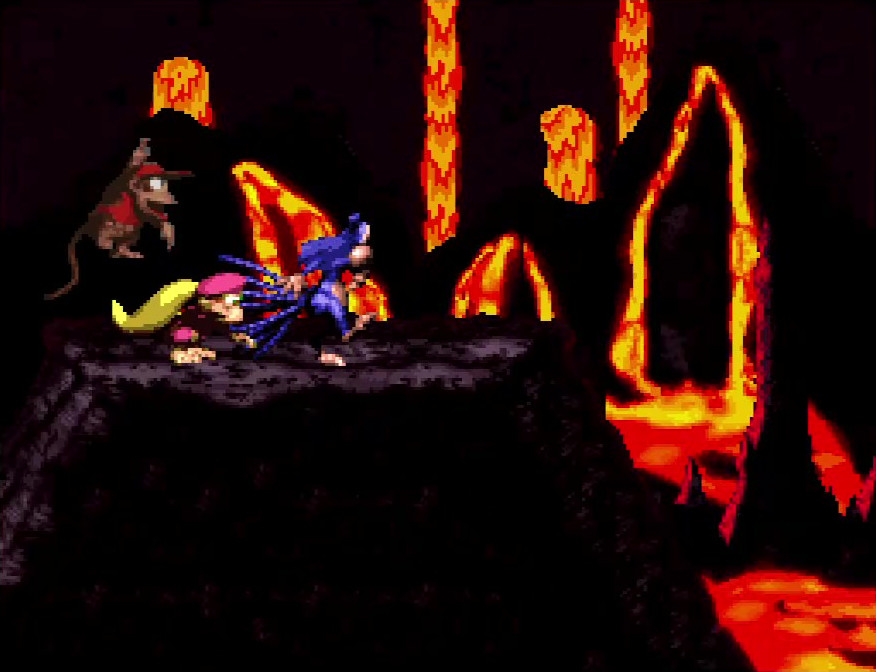
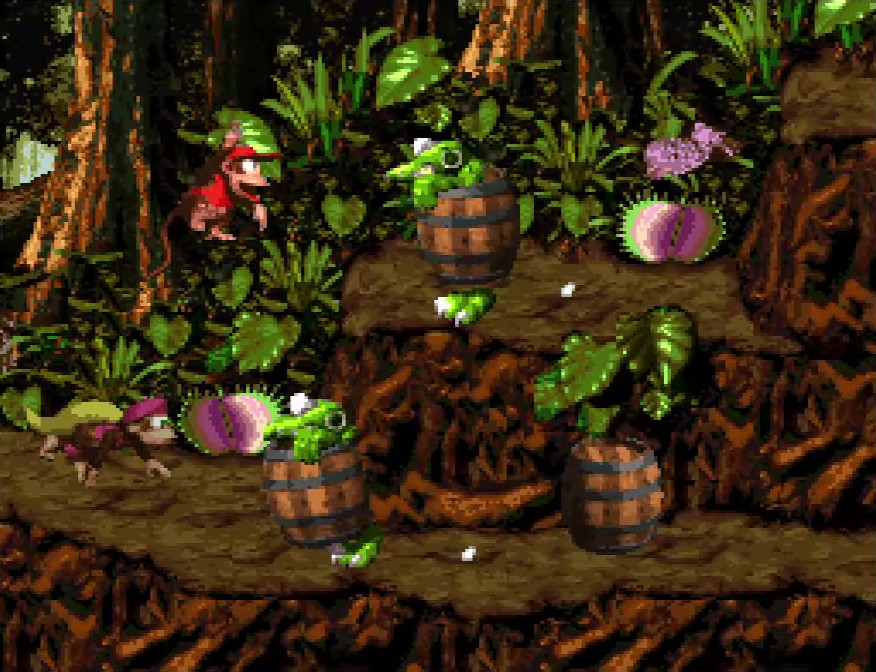
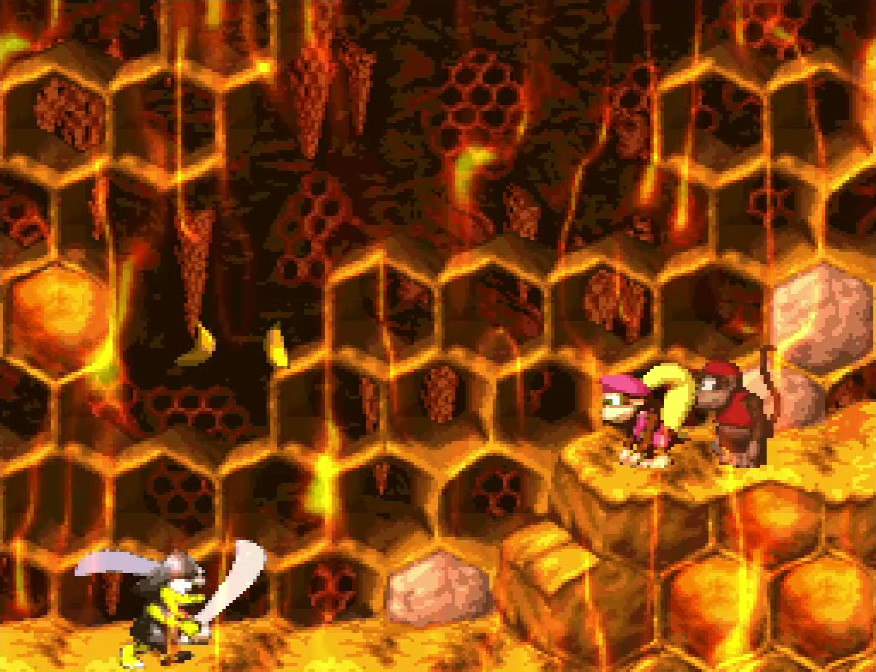
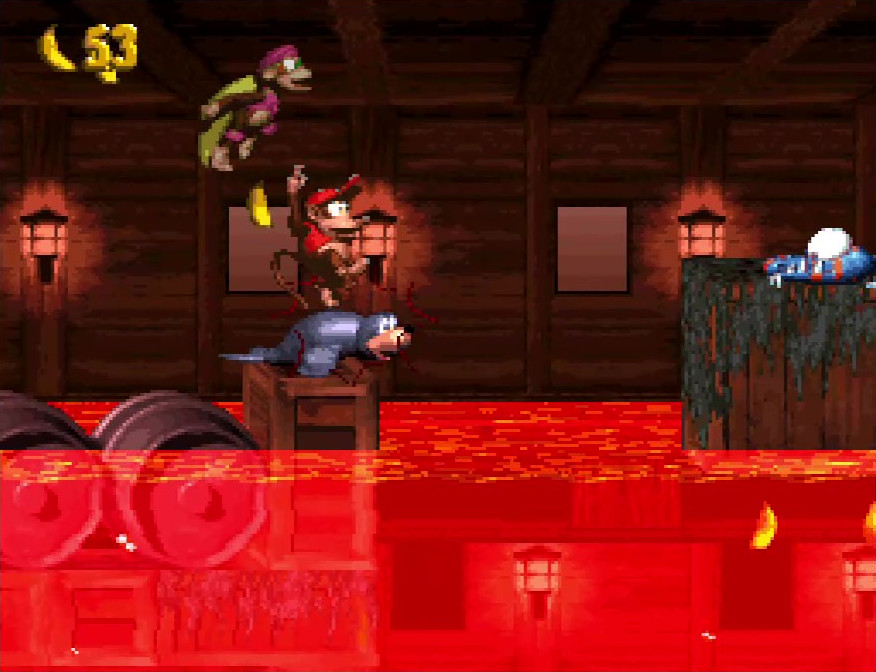
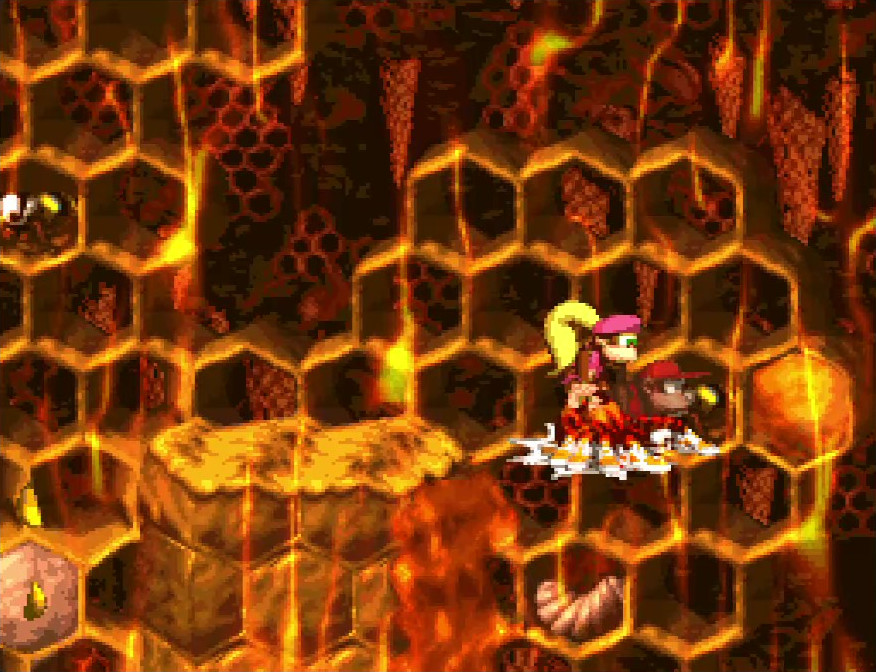
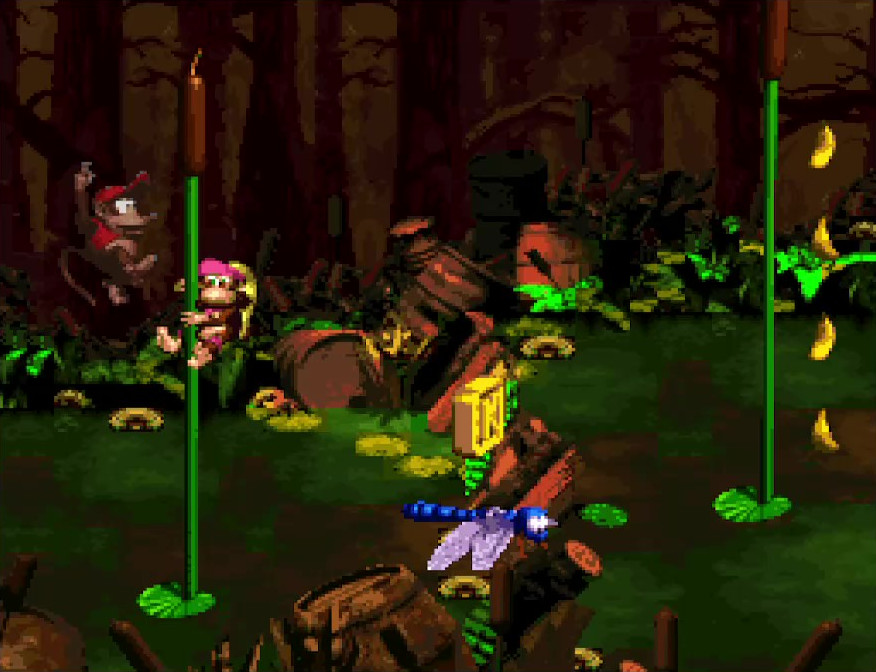
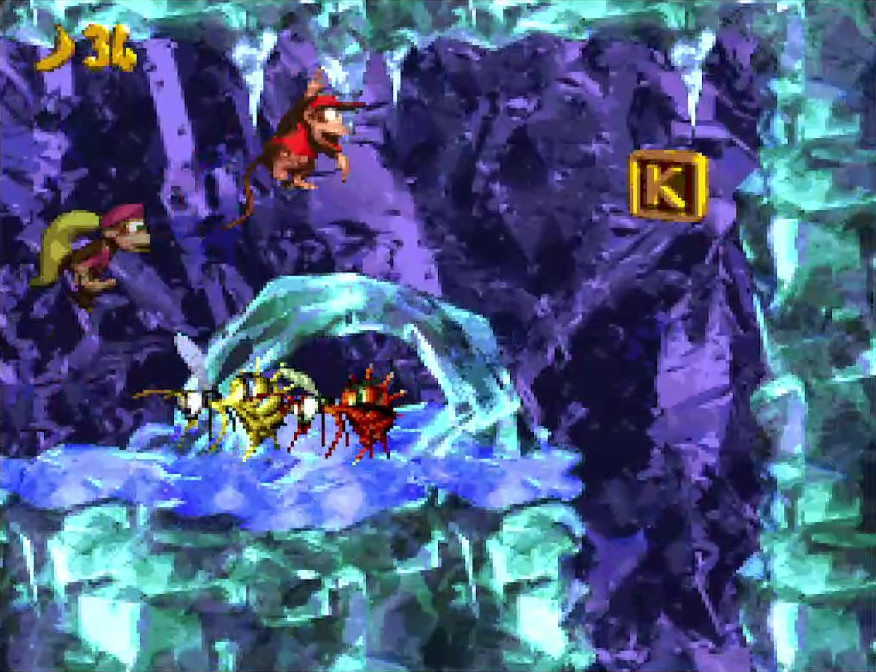
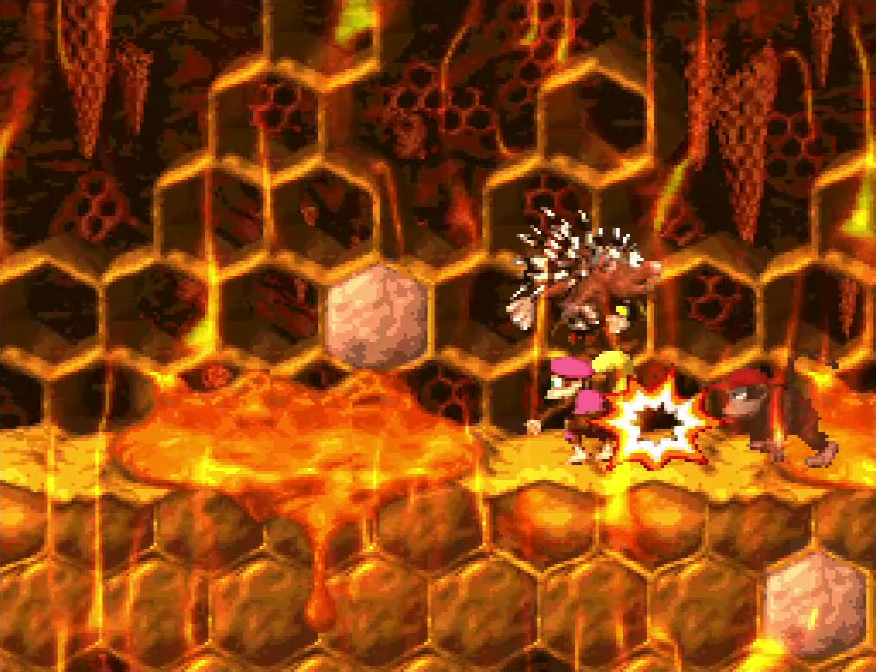
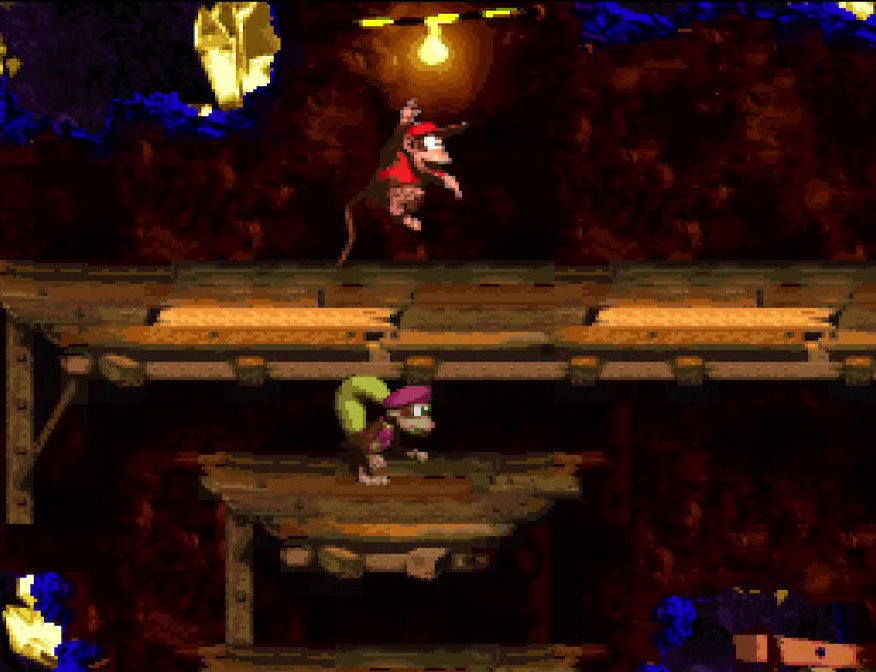
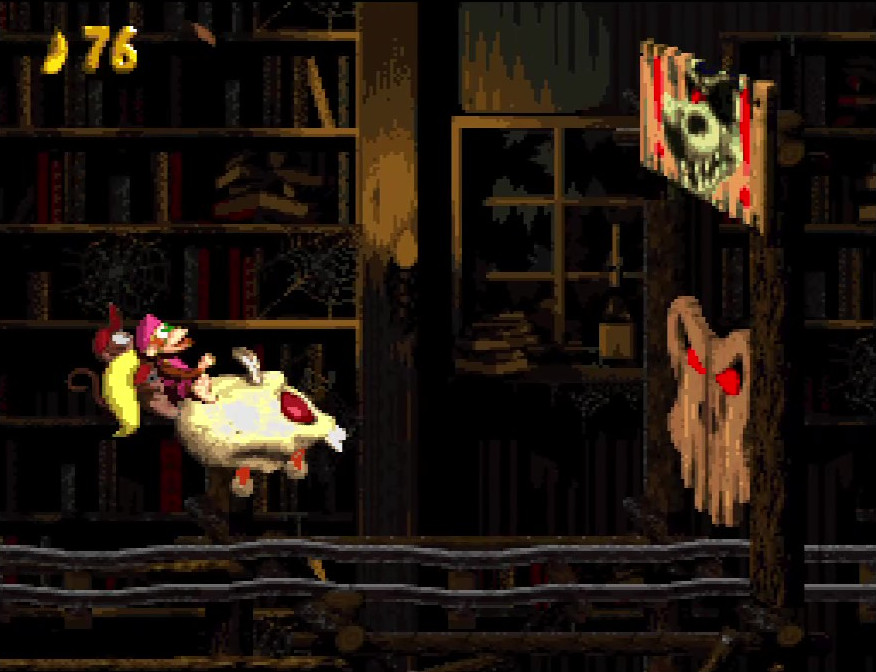
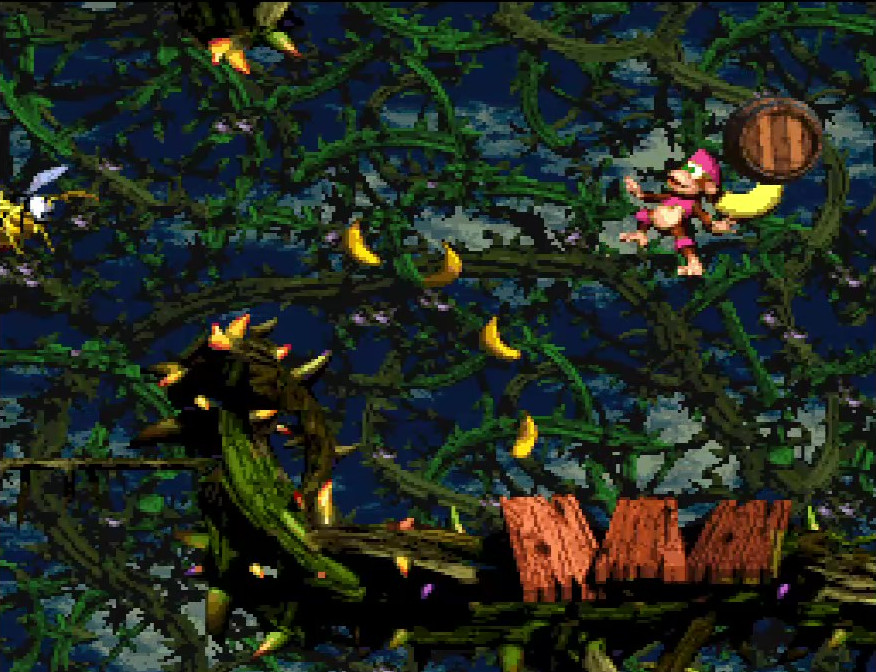
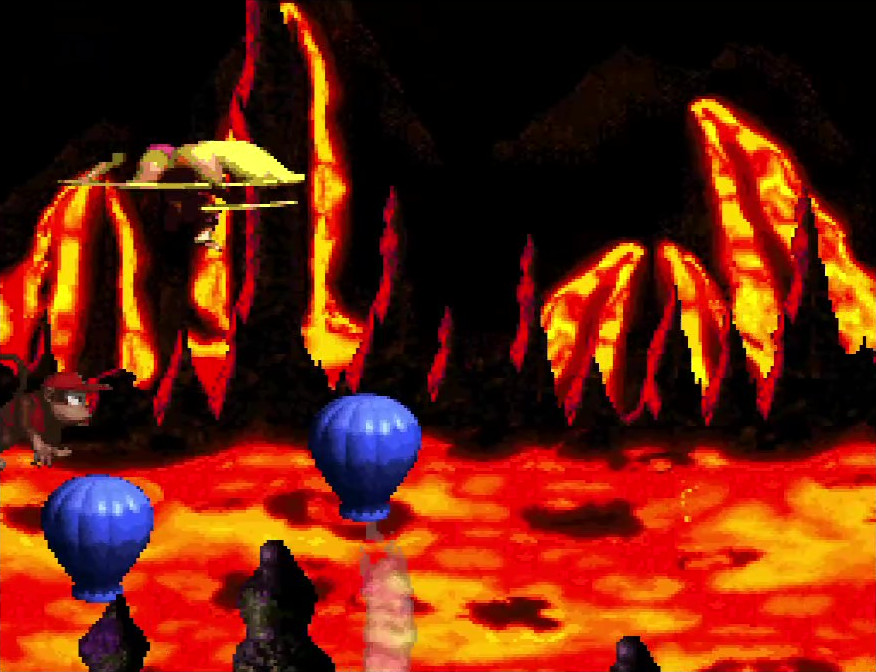
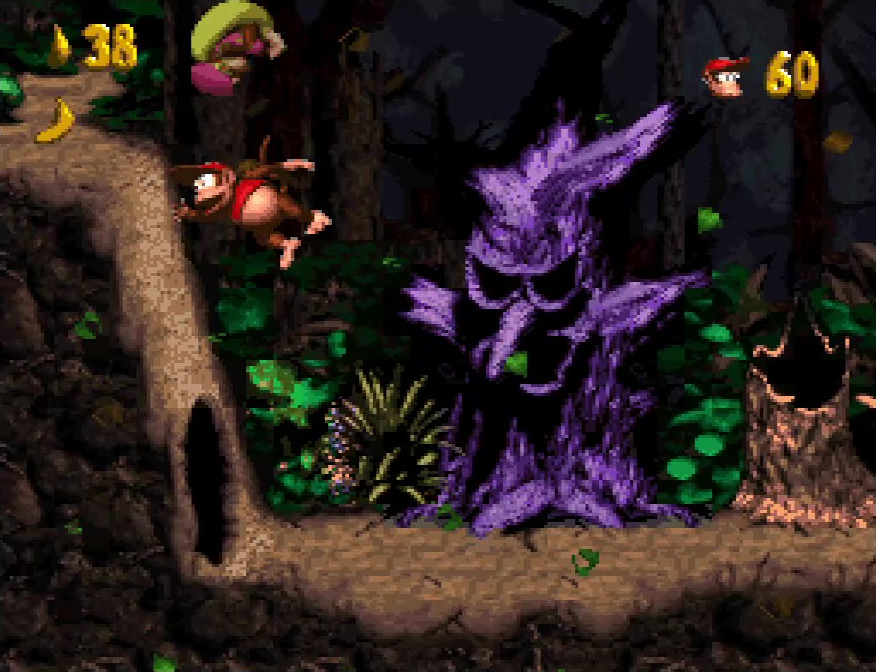
As a child, I loved to play Donkey Kong Country 2: Diddy’s Kong Quest; as an adult in my early thirties, I still love playing it. One of the reasons, among many, why is the game’s character movement feels almost perfect. Never do I feel as though I can’t adequately control Diddy or Dixie Kong as I navigate them through many levels of perilous adventure. As a game designer, I found myself wondering: what is it, exactly, that makes me love DKC2’s movement so much?

To begin answering that question, I’ll take a close look at the action verbs DKC2 employs related to the player characters. It’s not just a matter of analyzing the actions and movements in and of themselves, however; the level and enemy design of DKC2 are intentionally crafted to augment those basic actions. As is undoubtedly true for many games, it is the whole package together which creates that feel I love so much.

To break this lengthy dissertation into digestible chunks, this will be a three-part series. We’ll open up with a look at the basic movements and abilities of the Kongs themselves, as well as some special moves that are used to spice up the normal gameplay. After that, we’ll examine how the levels are designed to take advantage of the basic and special moves. Finally, we’ll look at the enemy designs and how those compliment the basic moves and abilities as well.

Kong Kapabilities

To begin this design dissection, we’ll look at the many forms of movement present for the Kongs in DKC2. First up: the core action verbs. Each Kong possess a base set of moves that you’ll be employing throughout the majority of the game.

Walk and Run

You have two basic ground movements, one for walking, and one for running. Diddy’s speed is slightly faster than Dixie’s, for both walking and running, but both feel fast enough that I don’t feel particularly disadvantaged when using the slower Kong. The actual movement speeds themselves feel just right to me; I’ve never found myself wishing that I could move faster or slower.

Triggering the run and walk actions are simple: hold the Y button and a direction to run in said direction; don’t hold Y, and that same directional input is a walk. Personally, I always appreciate it when games give me the ability to walk when I want to, even if most of the time I’m probably going to run. Having an easy-to-use slow option gives me that more precise control when I feel like I need it.

For 3D games, having easy walking also lets me get more immersed in the fantasy of inhabiting a character in a world. No one runs all the time in real life!

Accelerating from a standstill to a walk is near-instantaneous, which further helps with making the Kongs easy to control, but there is just enough acceleration that you don’t feel the characters instantly transition from idle to walk. Running, on the other hand, only happens after you press the Y button, which triggers the controlled Kong’s spin move before transitioning to the run. That animation helps convey a reason for why the character is suddenly transitioning to a run speed, while also giving you an attack move which is easy to trigger. If you were holding Y and start moving from idle, though, you just accelerate briefly into the run speed; again, just enough acceleration to make it not instantaneous, but short enough that it doesn’t impact your control over the character.

Speaking of spin maneuvers…

Spin

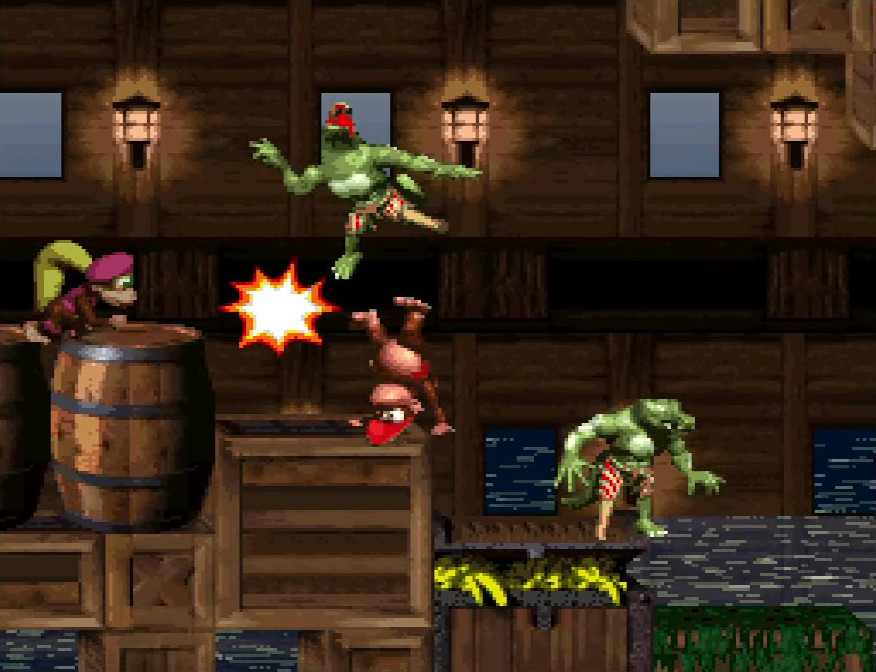
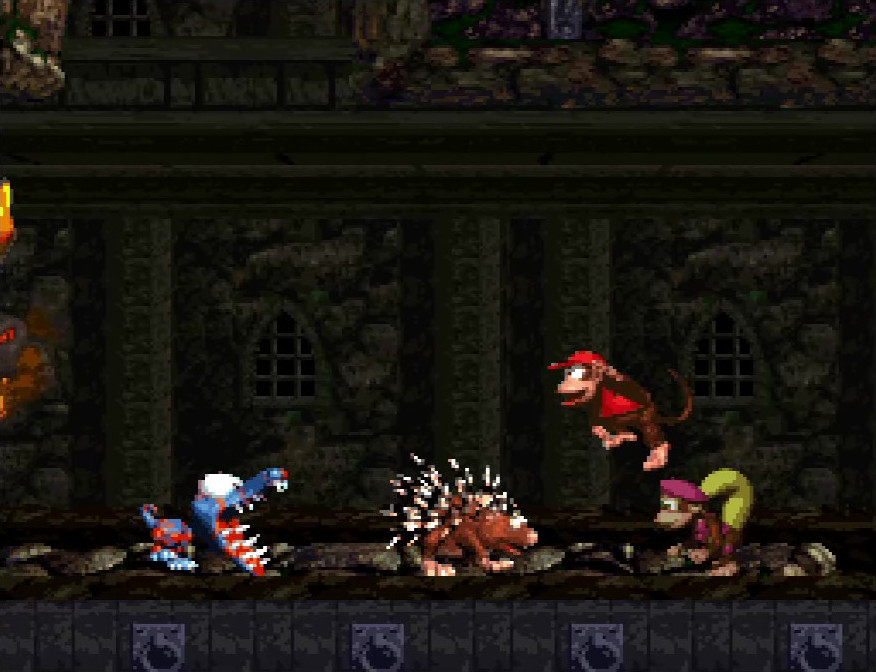
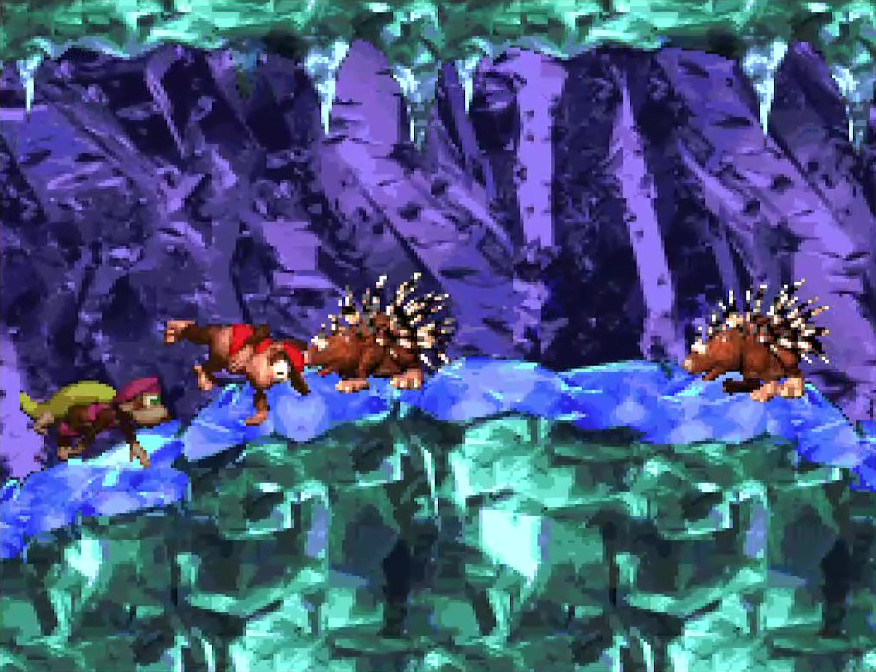
Both Kongs have a spinning maneuver, but each does it differently. The execution of both spin maneuvers result in the same outcome, however: pressing the Y button causes the Kong to perform a spinning attack move, which is capable of defeating most ground enemies; if Y is still held, then any directional ground movement will subsequently result in the Kong moving at a running speed.

As mentioned, the Kongs each have their own spin on the spin maneuver. Diddy’s is a cartwheel, looking quite acrobatic, while Dixie’s is a body spin, twirling her pony tail (termed by the game as a “helicopter spin”). Interestingly, Diddy’s cartwheel looks like a more natural action than Dixie’s, which can contribute to his move feeling faster than Dixies, but in fact both spin at the same speed and move the same distance, which means you aren’t disadvantaged when faced with level sections which ask you to use the maneuver.

Dixie’s helicopter spin serves a second purpose while in air: pressing Y while in midair causes Dixie to spin constantly, giving her a slower fall speed, and thereby giving the player greater control over where they want to land. Diddy does not have this ability, which helps give both Kongs distinct roles: Dixie is useful for air control, while Diddy is useful for moving more quickly.

Jump

An essential ingredient to most 2D platformers is the jumping action, and both Diddy and Dixie are more than capable of performing this function. Pressing the B button causes the selected Kong to jump into the air, up to approximately three times their own height. Tapping B causes a short jump, while holding B slightly longer results in a higher jump. While it may seem pointless to have this scaled jumping, having some control over your jump height makes you feel more in control than you would if you only had a single jump height.

There is more to the feel of the jump than the upward movement. Running and jumping allows you to cover more horizontal distance than walking and jumping, providing more encouragement to run through the levels. While in the air, you have full control over horizontal direction, giving you the ability to precisely place where you want to land and making air control feel responsive. When you fall, you accelerate to a constant speed, which you maintain until you hit the ground (or the enemy on it), which makes it easier to predict where your jumps will land.

Interestingly, it seems that your fall speed is the same as your jump speed; it takes the same amount of time to fall from the apex of your jump as it does to jump up to it. However, if you are moving in a horizontal direction while in midair, it seems to slightly increase the amount of time the Kong stays at the apex of the jump. This is something I only noticed when going through my recorded footage frame-by-frame to try and get ballpark estimates, but now that I think about it, this gives you a little more time to figure out where you want to land before you start falling. It’s a clever design, one that I hadn’t thought about before.

Most enemies can be defeated by jumping on them, and this jump attack is something you’re going to do a lot throughout the course of the game. The game encourages you to do this by giving you a greater jump height when you jump off the top of an enemy than when you jump from the ground, allowing you to cover greater distances. Even if you don’t actually jump off the enemy, landing on one grants you a small bounce acceleration that still lets you move up and onward. These movements help make bouncing off an enemy feel good.

The spin moves also have a role to play in performing jumps. While spinning off of a ledge, you can press the jump button (B) to cause the Kong to jump while in mid-air. This allows the Kong to cover more horizontal distance than they’d be able to cover by simply running and jumping. The timing on this is fairly forgiving; the game doesn’t want to impede you from pulling this maneuver off.

Duck

It’s easy to forget about the ability to duck, as it’s a passive move compared to walking, running, spinning and jumping. This move causes your Kong to duck down and hold still, effectively decreasing their vertical hitbox size by about half. This is used to less effect than other moves, but there are still places that will require you to duck under passing enemies, so it has a part to play in the movement design.

Team Throw

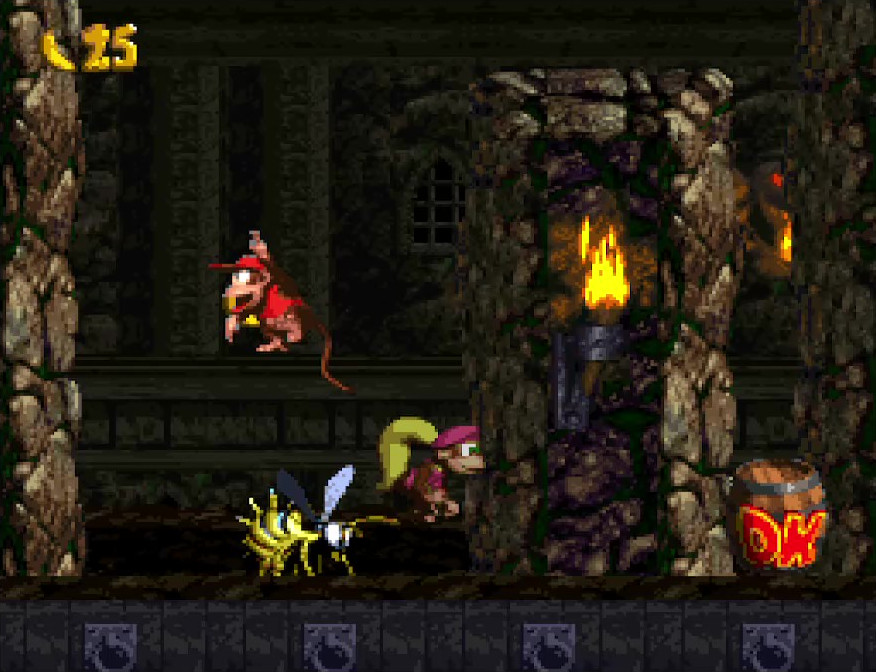
Finally, you can pick up your partner to put them on your Kong’s shoulders, then subsequently throw them by pressing Y (the normal throw button). If you hold the up direction as you throw, this results in launching your partner up into the air in a slow, controllable way; without this, your partner Kong is simply thrown to the ground, remaining where they fell until you come back for them (or they go off-screen, in which case they run back to you automatically). The horizontal throw can also be used to defeat enemies that could be defeated with normal attacks.

Special Skills

Now that we’ve discussed the basic Kong moveset, let’s examine cases where the game modifies these default maneuvers to introduce other forms of gameplay. These serve as an occasional change-up to how the game flows. Just as with basic movement, the feel of these special movements is important.

Climbing

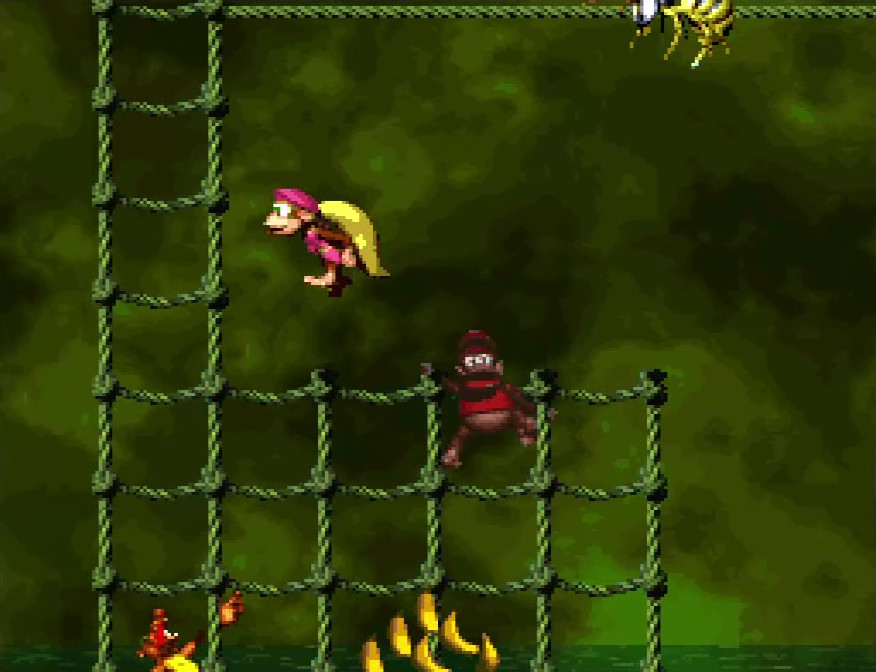
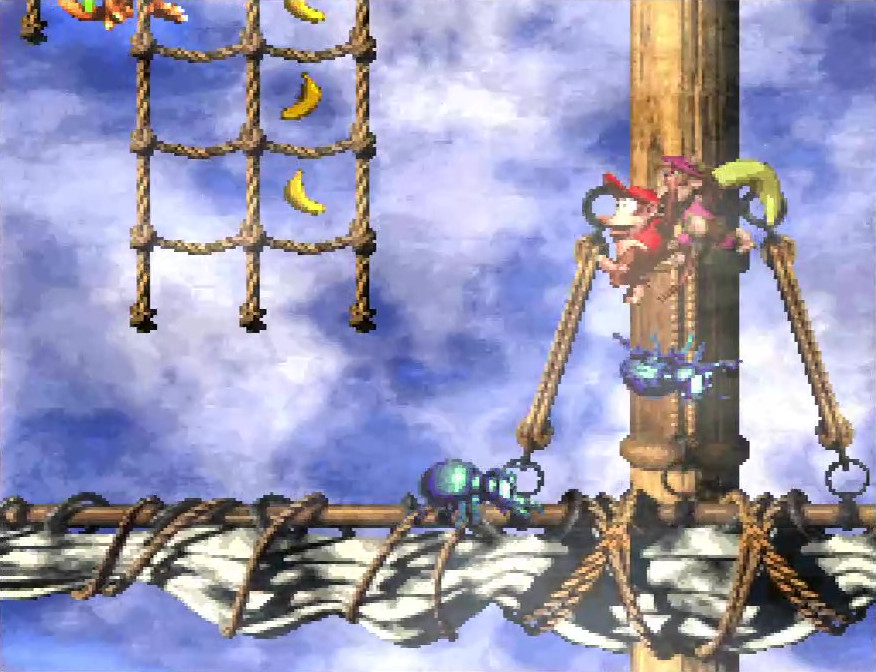
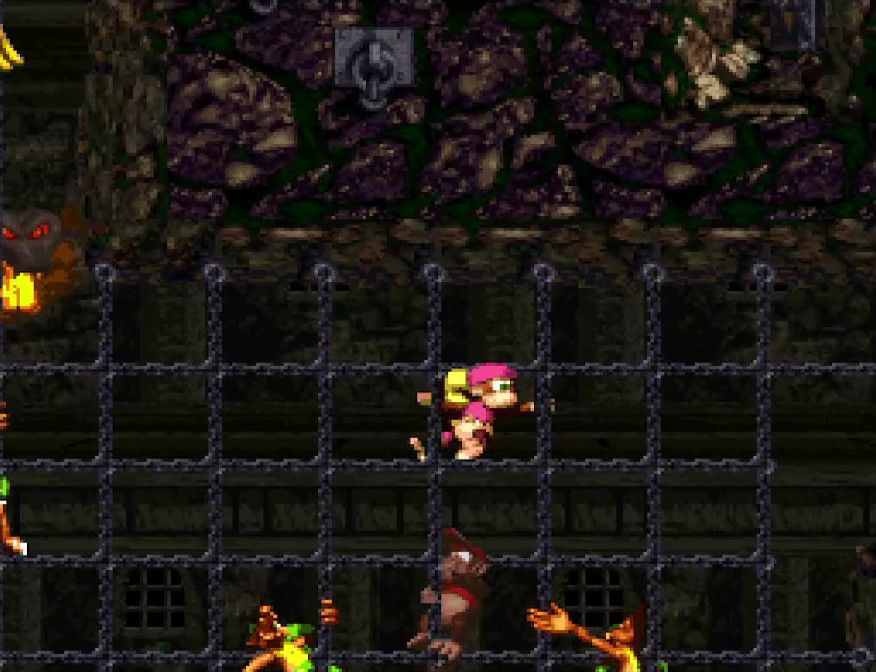
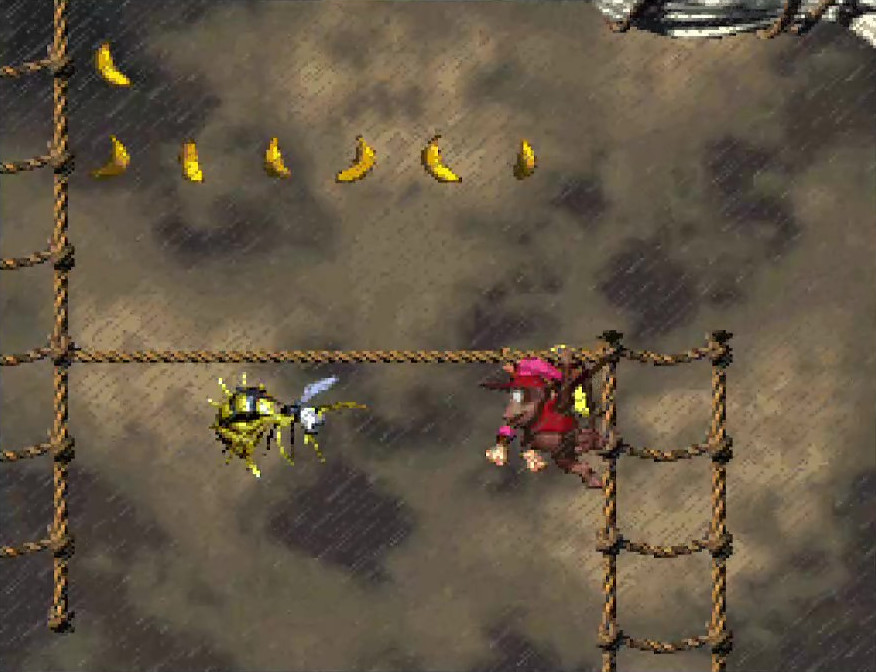
Throughout various levels, ropes are placed, which the Kongs can climb when you leap into them. While on a rope, your movement is restricted to a single plane, either horizontal or vertical (depending on which way the rope faces). Diddy and Dixie’s different movement speeds factor here as well, with Diddy being able to traverse ropes slightly faster than Dixie.

Keeping the rope climbing speeds fast, close to their walking speeds, means that it doesn’t feel like the game slows down during the climbing sections, so they still feel good to move around on. This, in turn, makes it fun to navigate through the various challenges the designers place along the paths the ropes and chains force you to traverse.

Swimming

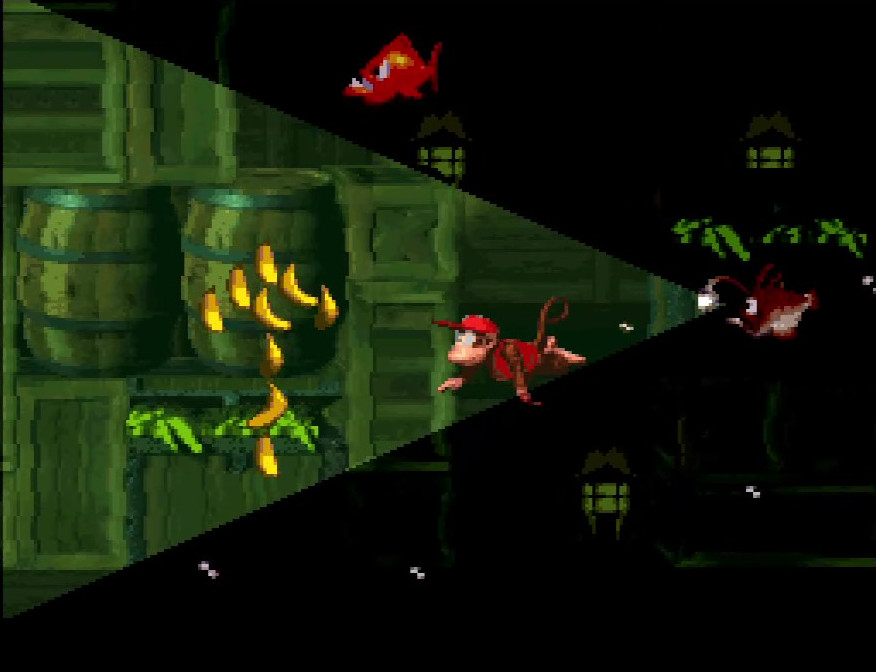
In some levels, there are water sections that the Kongs can swim in. Jump and spin attacks can’t be performed underwater, so the gameplay changes from defeating enemies to avoiding them. While underwater, you are able to move in all directions, but you sink downward unless you tap the B (jump) button to swim upward.

Like the climbing sections, your movement speed underwater is close to your regular movement speed, although the requirement of tapping the B button makes swimming more skillful than simple navigation; you have to time button presses to keep yourself afloat while swimming past enemies. Unlike the climbing sections, swimming sections allow you unrestricted horizontal and vertical movement, adding yet another flavor of movement variety to break up the rote platforming that dominates most of the game.

Flying

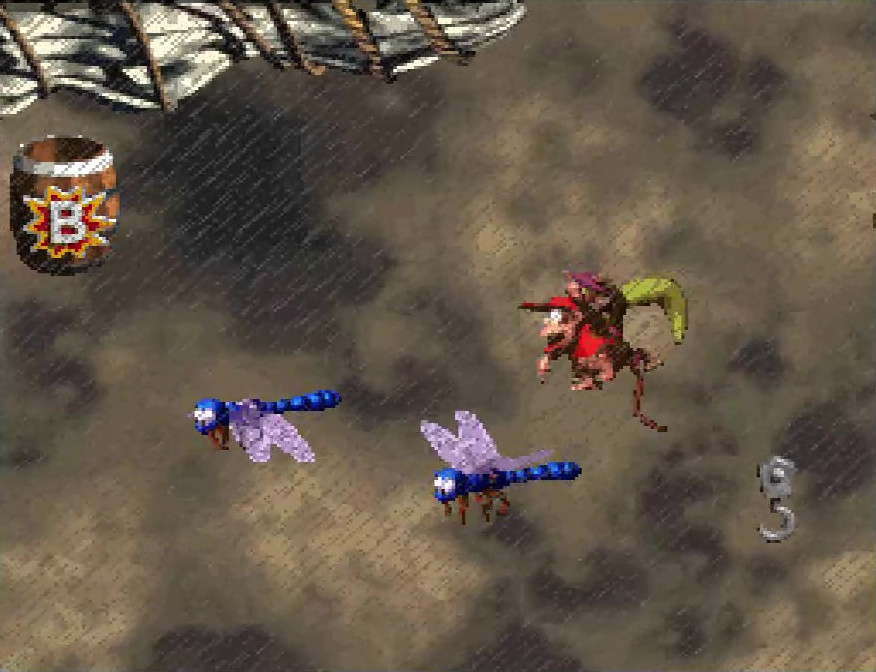
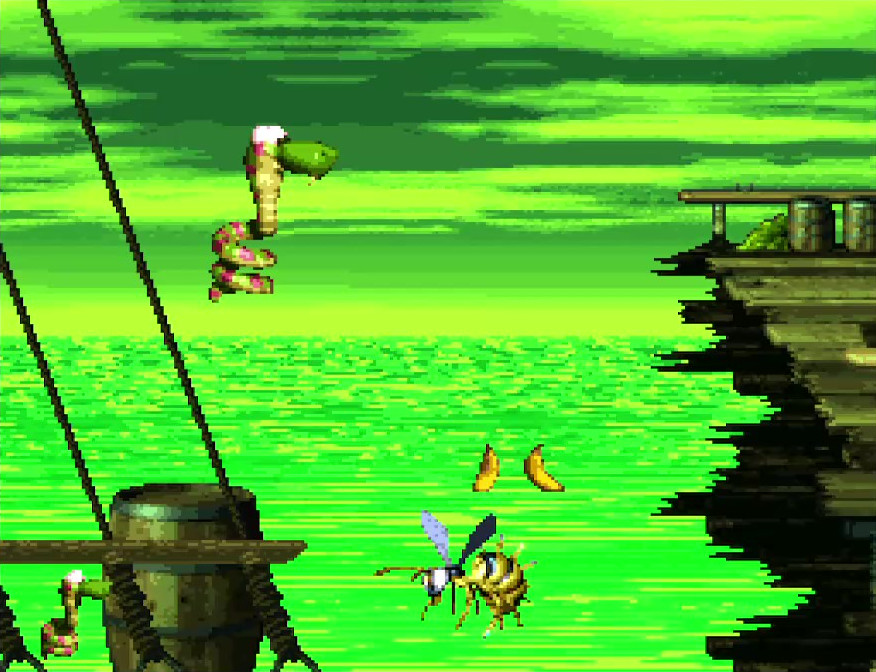
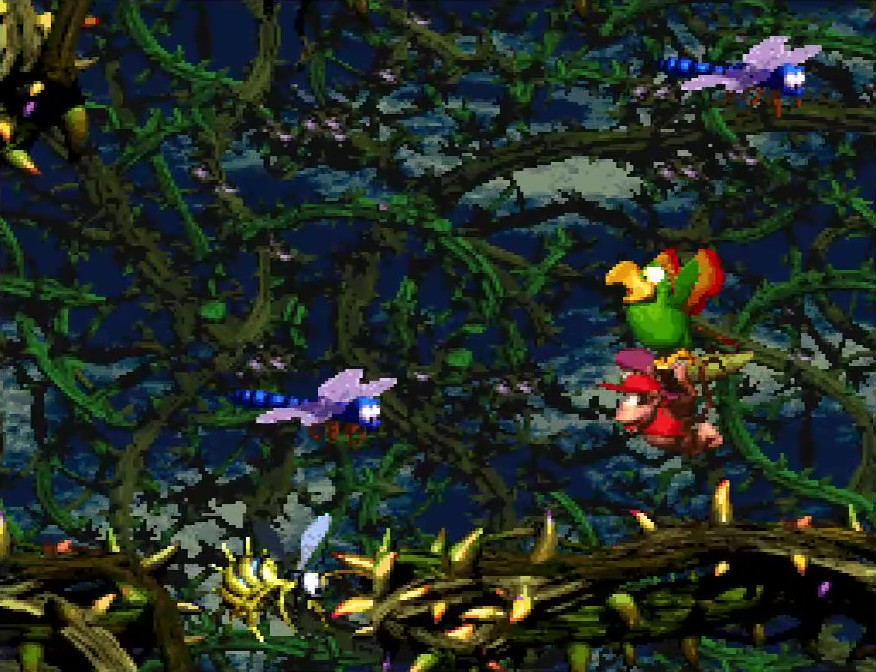
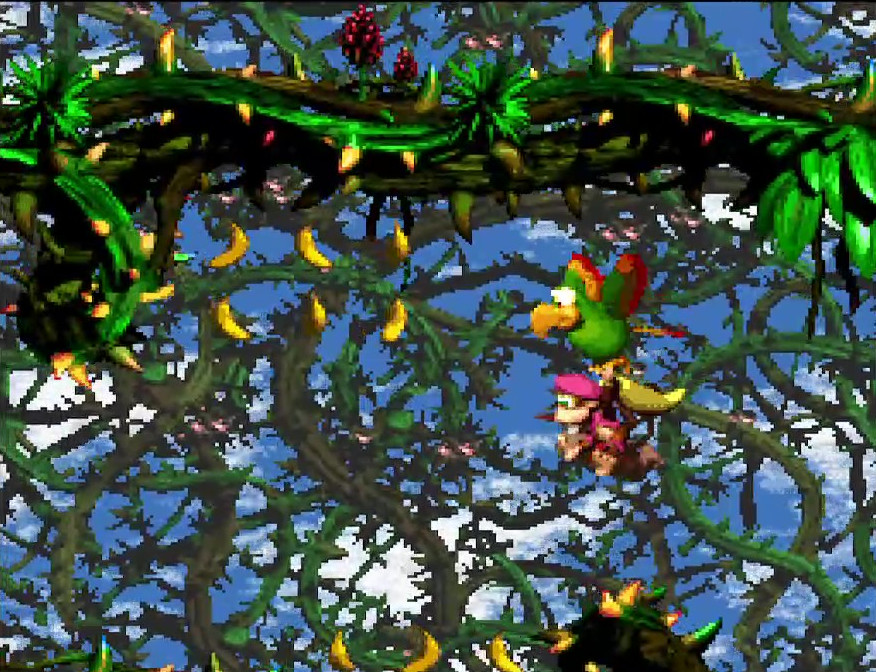
Some levels give you access to the Squawks animal buddy, a parrot that grants the Kongs the ability to fly. The flying sections are similar to swimming sections; you can move in all directions, but have to continuously tap B to move up or you float back down to the ground.

The similarity in how swimming and flying sections work from a movement standpoint allows for the designers to reuse player expectations for how those mechanics work, and avoid having to teach yet another new mechanic.

Speaking of animal buddies…

Animal Buddies

These are animals that the Kongs can ride (or, in some cases, transform into), and using an animal buddy changes what moves the player can perform. With all the animal buddies, there are similar base movement motions: there is a slower “normal” speed, and then a faster “running/swimming/flying” speed when moving while holding down Y. Beyond that, however, each animal introduces different changes to the movement equation.

Animals can be accessed in two ways. One is through a crate, in which case the Kongs ride the animal. While riding the animal, taking damage causes the Kong to fall off and the animal to run away; you can also choose to dismount the animal willingly. The other is by transforming into the animal itself. Dismounting the animal is no longer an option, so you are stuck with that animal’s movement changes. Usually, transformed mode is given when the level’s design explicitly requires that particular animal’s movements to progress through the level.

Either way, at some point in the level you’ll reach a “no-animal” sign, which removes the animal buddy and gives you some kind of reward. By giving an end to the animal buddy use, this allows for only having some parts of the level be designed around the use of the animal, and in some cases even have multiple animals within the same level. It makes the animal buddies another tool in the player’s movement arsenal.

Let’s take a look at the animals and what their movements add to the gameplay.

Rambi

A rhinocerous that gives you a faster running speed. Rambi is impervious to damage when jumping on enemies or running into them with its horn, only being vulnerable to attacks from behind (and certain projectiles). Holding down A prepares an even faster run in the direction Rambi is facing, plowing through enemies and breaking through hidden entrances to bonus areas.

Riding Rambi makes you feel almost invincible, so you feel more willing to move fast and make risky decisions. Enemies are mostly no longer a challenge for you. These things combined make Rambi feel amazing to use. To account for this, oftentimes Rambi’s location in a level is hidden, making finding him a reward for looking around the levels, rather than blazing through them.

Enguarde

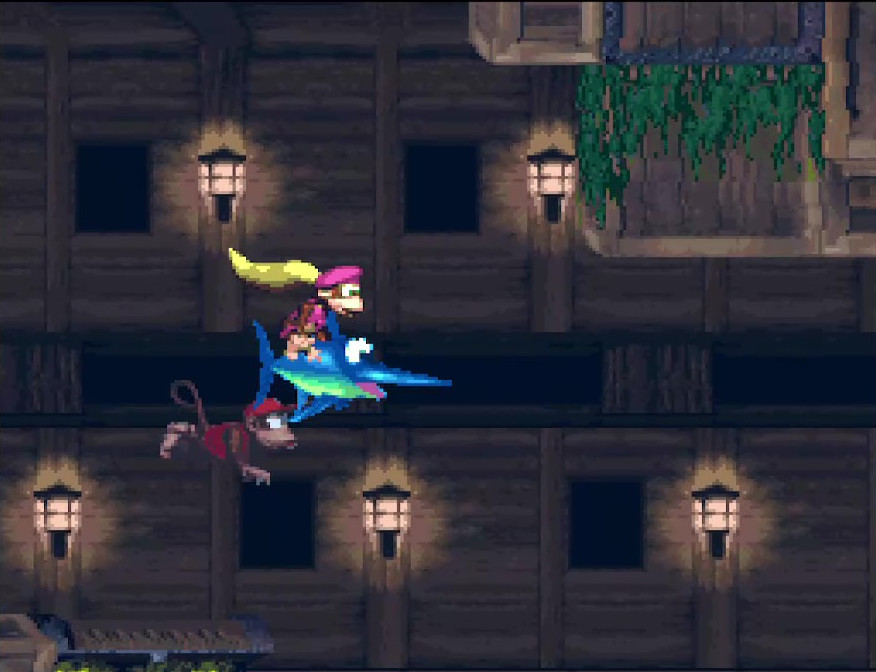
A swordfish that gives you full movement control underwater. No longer do you need to tap B to stay afloat; Enguarde hovers in place when idle, and moves in whatever direction you input. The sharp-looking bill on its face can defeat any underwater enemy, and clearing enemies makes the underwater sections that much easier.

Having Enguarde removes a lot of the challenge from swimming movement, which means riding Enguarde feels similar to riding Rambi, in that you feel more free to move where you please, with ease. Since Enguarde makes underwater movement and gameplay much easier, his locations, like Rambi’s, are hidden well in the level, so that finding and using him is a reward for good exploration.

One could think of Enguarde as the underwater version of Rambi.

Squawks

As mentioned, Squawks is a parrot that gives you the ability to fly in a stage. Unlike Enguarde, you don’t get to hover in place when idle, so there is still challenge involved with using the bird. Squawks also has a ranged attack, hurling eggs out of its mouth in a parabolic trajectory when the Y button is pressed.

Unlike Enguarde, who generally makes level movement easier, Squawks requires more care to ride. Any contact with an enemy damages Squawks, so you are required to be careful as to where you fly. The egg projectiles don’t fly straight, so aiming them to hit enemies, while maintaining flight, is in and of itself a challenge for the player. As such, Squawks is often placed in locations that are easier for the player to find.

Squitter

Squitter gives you the ability to shoot webs. Pressing Y delivers an attack web which can defeat any non-invulnerable enemy; you can control the arc of the shot by holding up or down on the direction input after the attack web has been fired. Pressing the A button (or, alternatively, either the L or R buttons) shoots a slow-moving platform web. Pressing the platform web button again after firing deploys the web platform, giving you something to stand on in mid-air. These platforms disappear after a short period of time, however, so you need to move quickly. Unlike other ground animals, Squitter cannot defeat enemies by jumping on them, so you need to keep away from foes and blast them from afar.

From a design standpoint, Squitter is a massive change to your movement toolset. Riding him takes away your ability to jump on enemies, but gives you an infinite amount of projectiles, making you adopt a long-ranged approach to defeating enemies. Creating platforms at will allows you to avoid hazards, pitfalls, and enemies that would otherwise prove difficult or impossible to overcome; they also provide an interesting way to add more vertical movement to the regular platforming action.

Rattly

This snake has an extremely high jump, allowing you to reach higher platforms than you could with the Kongs by themselves. Holding down A charges Rattly to make a super-jump, similar to how holding A charges Rambi to make a super run. Rattly defeats any enemy that it jumps on, except for ones that are invincible. Interestingly, when Rattly moves along the ground, movement consists of small jumps that result in a lurching style of movement; this is perhaps an encouragement to move by pressing the jump button, which feels more fun to do.

Rattly is all about the jump. He can jump on nearly anything and live, and, since your spin attack is taken away while riding him, you are strongly encouraged to jump on foes in your path. The high jump allows for adding taller sections to levels that take advantage of that bigger jump height.

I am leaving out Glimmer and Clapper because they do not change your movement mechanics.

Careening in Carts

Three levels let you ride in carts. While in a cart, the Kongs move in a consistent rightward direction at a controlled speed (you can go faster by holding the forward directional input, and slower by holding back). Depending on the level, jumping will either cause both Kong and cart to jump, or just the Kong. With the consistent movement, beating these levels is about reacting to upcoming threats quickly; you aren’t given time to ponder your next action. This can be frustrating while learning the level, but it results in satisfying rushes once you consistently react correctly to the level’s challenges.

What does this sudden change in movement bring to the design table? The rush of speed, for one. It’s fun to move fast through a level, much faster than you normally get to move. Along with that speed comes reduced amounts of time to react to level hazards. You can’t stop to figure out how to get past those hazards, either; you’re hurtling at them at high velocity, and you have to make quick choices about how to get past them. This is hard, but exhilarating, and they add a health dash of experiential spice to the movement gameplay.

These cart levels are ones I loved playing as a kid. That said, I think it’s good that there aren’t many of these kind of levels, as the high tension throughout would make level to level gameplay far more exhausting if that was the majority of the action.

Tossing in Throwable Objects

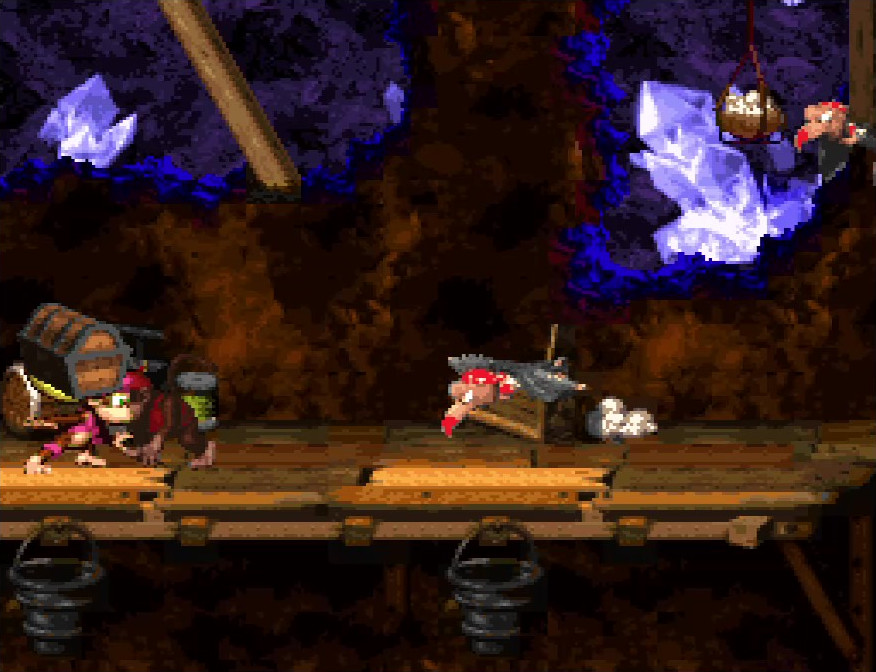
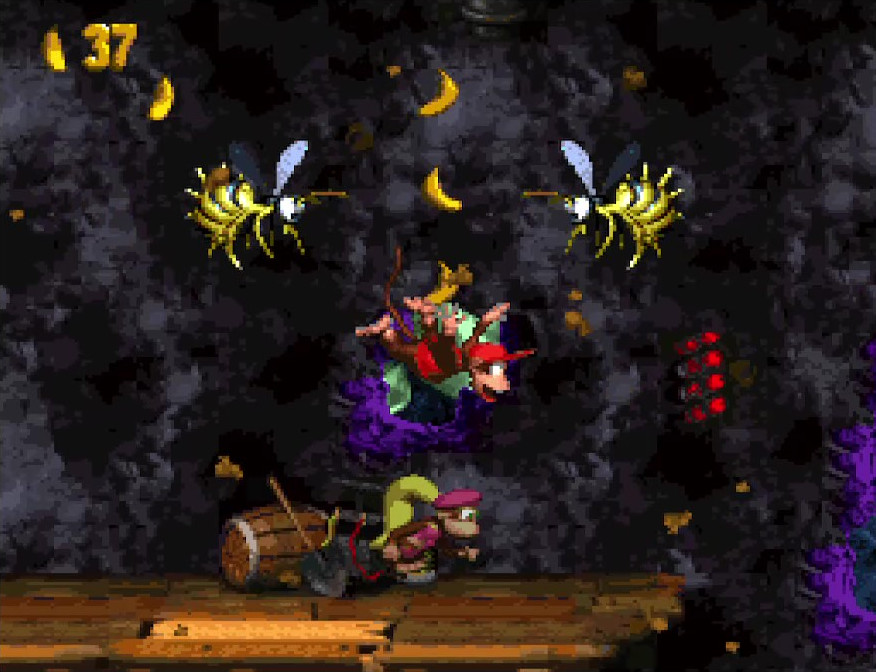
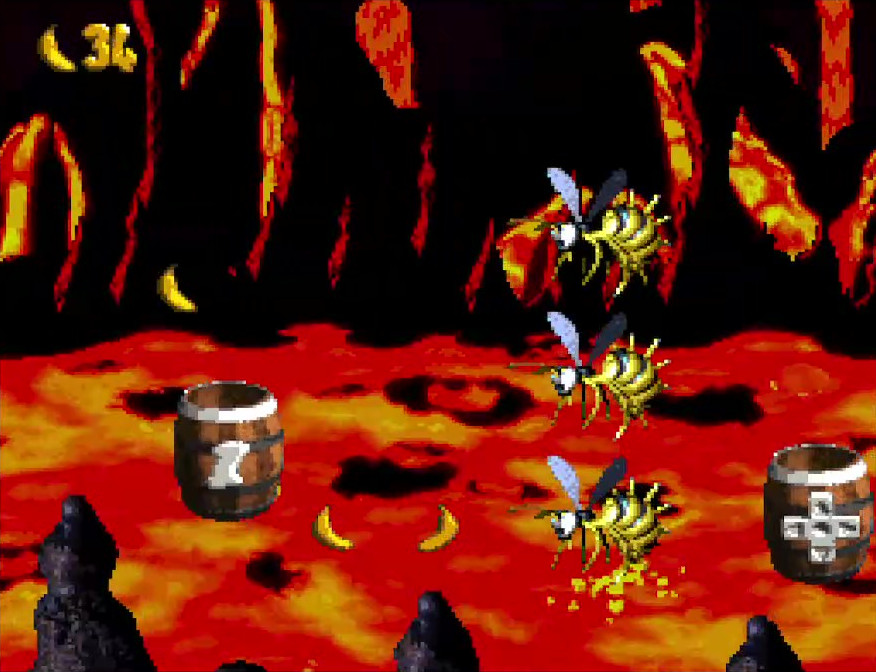
One final Kong ability remains: throwing objects. Both Kongs are capable of picking up and holding barrels and other objects placed throughout the level by holding the Y button; releasing the Y button causes the Kong to throw the projectile, which will defeat any enemy that it touches along the flight path. Aside from certain animal buddies, this is the only ranged attack you have access to in the game.

In many cases, the objects will break on impact, whether with the world or an enemy, making them a single-use resource. This forces you to consider carefully when you encounter a projectile to throw; should you use it now, on the nearest enemy, or should you try to hold on to it to use on some future part of the level with a more difficult obstacle, or a bonus area entrance? Your movement isn’t impeded while holding a barrel, so you still have the same level of control that you do normally; however, since objects break on contact, and you are forced to throw the object when you jump on an enemy, holding on to a projectile you wish to keep intact transforms the gameplay from defeating enemies to avoiding them until such time as you wish to use the projectile. This is a great way to subtly introduce a change in gameplay.

Interestingly, I always thought in my mind that you moved slowly while holding on to a barrel, but in testing I found that this is actually not true; you still move the same amount regardless of whether you’re holding an object or not. This is an interesting psychological effect; I wonder if the designers intended it, or if it was just a byproduct of our expectations for movement with held objects.

What if you don’t want to hold the projectile right now, but still need to keep it around? You can hold down and release Y to set the object back down on the ground, where it will wait for you to collect again. If you move far enough to cause the object to go off-screen, however, it resets its position back to where you found it; while this was probably something introduced by the technological limitations of the SNES days, rather than a design decision, it’s something you still have to consider when setting the object down.

The way in which Diddy and Dixie throw projectiles differs for each. Diddy picks up objects with his hands and throws them in a flat, shallow arc that is almost effectively a straight line; Dixie picks up objects with her ponytail (boy, her hair can really defy the laws of physics, can’t it) and throws them with a more pronounced arc. Because her hair is on her head, the release point of projectiles Dixie throws is higher than Diddy’s, resulting in making it easier to hit enemies that are up in the air. Both Kongs are able to jump while holding objects, which provides additional control over where the projectile is thrown. Since Diddy’s throw starts lower to the ground, jumping and throwing is almost essential when throwing with him to get good distance. Giving the two Kongs different throwing styles further differentiates between using the two Kongs, making it useful to have both around to switch up which one you use for a given situation.

There are many kinds of objects the Kongs can throw throughout their journey. Each kind of object provides different characteristics that affect player strategy for using them.

Barrels

This is the bread and butter projectile of the game: a simple, metal-banded wooden barrel. You can throw it normally, which will fling the barrel forward and cause it to break on impact with the ground (plowing through however many enemies were in its way), or you can heave it upwards into the air, which will cause it to land softly enough to not break on impact, and subsequently will roll along the ground (and through enemies) until it hits a wall or falls off a ledge.

Crates

Crates, on the other hand, are square projectiles that clearly communicate that they won’t roll. They also break on impact, regardless of how you throw them, making them a much more limited resource.

Buddy Barrel

The buddy barrel contains your partner Kong, if you lost them at some point during gameplay, and when the barrel breaks open you get your partner back. Interestingly, the buddy barrel’s impact mechanics are similar to the crate, in that it breaks immediately on impact with the ground or with an enemy, so when there is no Kong in the barrel the two objects are pretty much the same, functionally.

Cannonballs

These spheres of solid metal do not break on impact with anything, but they also do not roll when they hit the ground. Because of their indestructible nature, they are useful as reusable projectiles or shields for as long as you can keep from throwing them into a pit.

Chests

Chests break only on impact with enemies (or bonus area entrances), and they contain some form of beneficial pickup (or “goodies”) which gives you something of value, from banana bunches to life balloons (extra lives) to Kong letters, and everything in between. Since they don’t break on hitting the ground, you pretty much have to use them on enemies, which means you’ll have to find an enemy to use it on or you won’t be able to break it.

TNT Barrels

The holy hand grenade of DKC2, these explosive barrels are capable of destroying any enemy in a fiery explosion. This explosion has a small radius that will destroy any other enemies it touches. This barrel is often the only means you are given to deal with invulnerable enemies, which means being given one can be a sign that such an enemy is coming up.

To Be Kong-tinued

We’ve taken a deep look into the movement of Donkey Kong Country 2. From the simplest, basic moves to the variations introduced by special abilities, controlling the Kongs feels tight, responsive, and fun. But having characters that move well is only part of the gameplay story; the environments the Kongs move through and the enemies they fight contribute just as much to the feel of the movement as the movement itself.

In the next part of this series, we’ll take a dive into the level design of Donkey Kong Country 2, and see how much it impacts how the movement feels. Stay tuned!

This is Part 1 of a 3-part series. Check out all the parts here!

Part 1: This post.
Part 2: Here!
Part 3: Here!

Postmortem: Sanity Wars Reimagined

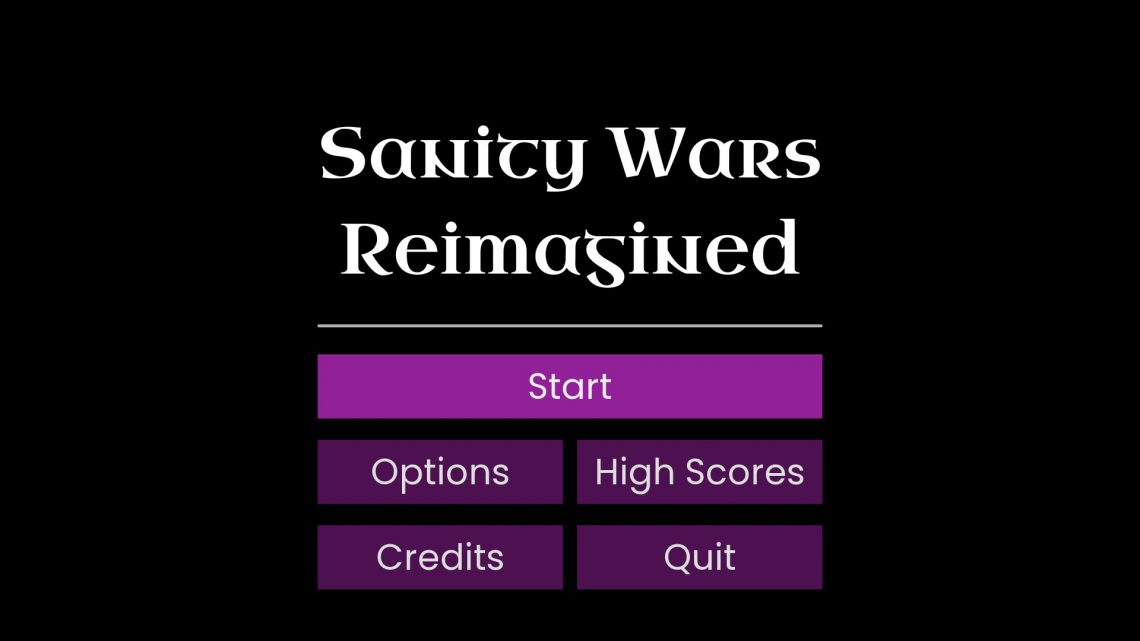
After seven months of development, Rebecca (PixelLunatic) and I have released Sanity Wars Reimagined! Along the way, we learned a lot, lessons we hope to apply to future games we develop. In this article, I want to dig a little bit into what we learned, from what we were initially trying to do to where we wound up, and the various lessons learned and mistakes made along the way.

You can check out Sanity Wars Reimagined on Itch.io!

This project started with a discussion Rebecca and I had about where things were from a long-term standpoint. For the past few years, we’d attempted, and abandoned, various prototypes, and it seemed like we were still far off from actually releasing a product. At the time, I had just come off of a month-long project exploring the creation of game AI; my intent was to start another project aimed at making improvements to the dialogue system. During our discussion, however, Rebecca pointed out that, while our ultimate goal was to make games and sell them, we had a bad habit of not committing to anything long enough to get it released. What’s more, she was concerned that this pattern of starting and abandoning projects wasn’t good for our morale.

She was right to be concerned about this; I’d felt that making an actual release was still a point far off in the distance, and this was making it easier for me to accept the idea of working on non-release projects, to “gain experience”. How would we ever learn how to improve, though, if we never got our projects to a releasable, playable state? Only two of our game jam games and one of our prototypes had ever been given to other people to play, so we had very little feedback on where we needed to improve. I realized that we couldn’t keep waiting to release something until “we got better”; we needed to make something and release it, however bad it may be.

We decided that we would start with a small project, so that it would take less time to get it to a releasable state. To that end, we determined that the project should be a remake of our first jam game, Sanity Wars. By remaking a game that was already released, we thought, we could focus on actually building the parts needed to make the game work; since I’d made those things work previously, we would hopefully avoid the pitfall of trying to create mechanics that were beyond our current skill to implement, or would take too much time to build. Why Sanity Wars? Out of all the previous jam games we’d made, it seemed like the most successful one, so we thought we could just add some polish, redo the art (since Rebecca did not do the original’s art), and it would be fine.

With that, our next project was set: Sanity Wars Reimagined. We would stay faithful to the mechanics of the original, aiming only to remake them in Godot, as this would be quicker than trying to iterate and make new mechanics. I would also take the opportunity to try and make systems that would be reusable in future games; ideally, we would treat Sanity Wars Reimagined as a foundation that we would directly expand upon for the next game. Since the original Sanity Wars was done in three full days, I thought this project wouldn’t take long to complete. Accounting for our busy adult schedules, I estimated the work would take two weeks to complete; at most, a month.

It didn’t take two weeks. It didn’t take a month. It took seven months before we finally released Sanity Wars Reimagined on Itch.io. Along the way, we made significant modifications to the core mechanics, removing multiple parts that were considered essential to the original Sanity Wars; even with those changes, the end result was still not that fun (in our minds). There were many times during the development period where it felt like it was going to drag on and on, with no end in sight. All that said, I still think Sanity Wars Reimagined was a successful release.

Why do I think that? To answer that question, I want to examine what technologies we developed during the project, what mistakes we made, and what we plan to do to improve things for our next project.

Technologies Developed

A lot of what I made from a code standpoint was able to be imported back into my boilerplate Godot project, which will then be available from the start when I clone the Genesis boilerplate to make any future game project. In doing so, I’ve hopefully decreased the amount of development time needed for those projects.

Genesis is name of a tool I created in NodeJS that lets me keep a centralized Godot boilerplate template and create new projects from that boilerplate using simple commands in a command line interface. To give a non-technical summary, it allows me to quickly create and update new Godot projects that include common code that I want to reuse from project to project.

Here are some of the things that I’ll be able to make use of as a result of the work done for Sanity Wars Reimagined:

Resolution Management

There is a lot to consider when supporting multiple resolutions for a game, especially one that uses a pixel art aesthetic. I was already aware of this before committing to figuring out a solution for Sanity Wars Reimagined, but I underestimated just how much more there was to learn. The good news is that I created a solution that not only works for Sanity Wars Reimagined, but is generalized enough that I can use it as the starting point for future games.

I’ll talk in brief about some of the struggles I had to contend with and what I did to solve them.

For starters, when working with pixel art, scaling is a non-trivial issue. Because you are literally placing pixels in precise positions to render your art aesthetic, your scaling must always keep the same aspect ratio as your initial render; on top of that, it must specifically be increased in whole integer factors. This means you can only support a limited number of window sizes without messing up the pixel art. That plays a huge factor in determining what your base size is going to be; since most monitors use a 1920px by 1080px resolution size, your base needs to be a whole integer scale of 1920×1080, or else the game view is not going to actually fill the whole screen when it is maximized to fill the screen (aka fullscreen).

The way fullscreen modes are typically handled for pixel art games, when they attempt to handle it at all, is to set the game view to one of those specific ratios, and letterbox the surrounding area that doesn’t fit cleanly into that ratio. That is the approach I chose for my fullscreen management as well.

Godot does give you the means to scale your game window such that it renders the pixel art cleanly, and you can also write logic to limit supported resolution sizes to only those that scale in whole integers from the base resolution. However, there is a catch with the native way Godot handles this: any UI text that isn’t pixel-perfect becomes blurry, which isn’t a great look to have. I could have switched to only using pixel-perfect fonts, but that wasn’t the look I wanted the game UI to have. After spending a lot of time experimenting with ways to handle this in Godot’s settings, I determined that I would have to create a custom solution to achieve the effect that I wanted.

I wound up talking to Noel Berry (of Extremely OK Games) about how Celeste handled this problem, as its crisp UI over gameplay pixel art was similar to what I was hoping to achieve. He told me that they actually made the UI render at 1920×1080 at default, and then scaled the UI up or down depending on what the game’s current resolution was. This inspired me to create a version of that solution for Sanity Wars Reimagined. I created a UI scaling node that accepts a base resolution, and then changes its scale (and subsequently the scale of its child and grandchild nodes) in response to what the game’s current resolution is. It took a lot of effort, but in the end I was able to get this working correctly, with some minor caveats*.

* I’ll be coming back to these caveats later on in the article, when I discuss mistakes that were made.

Overall, I’m very pleased with the solution I developed for resolution management in Sanity Wars Reimagined, and ideally this is something that should just work for future pixel art-based games.

Screen Management

Another system I developed for Sanity Wars Reimagined is a screen management system that supports using shaders for screen transitions. Although my boilerplate code already included a basic screen manager that was responsible for changing what screens were being currently portrayed (MainMenuScreen, GameScreen, etc.), a significant flaw it had was that it didn’t provide support for doing screen transitions. This was going to be a problem for Sanity Wars Reimagined, as the original game had fade transitions between the different screen elements. I thus set out to refactor my screen management to support doing transitions.

In the original Sanity Wars, the way I accomplished the fade was through manipulating the drawn image in the browser’s canvas element (as the original game was built using HTML/JavaScript, the technologies I was most familiar with at the time). It was hardcoded to the custom engine I’d built, however, and there wasn’t a direct way to achieve the same effect in Godot. It’s possible I could have made the fade transition, specifically, work by manipulating the screen node’s modulation (visibility), but I didn’t feel comfortable making direct changes to node properties for the sake of screen effects, especially if I wanted to have the ability to do other kinds of transitions in the future, such as screen slides or flips; anything more complex than that would be outright impossible through mere node property manipulation.

My focus turned towards experimenting with a different approach, one based on using Godot’s Viewport node to get the actual render textures, and then manipulating the raw pixels by applying shaders to the render images of the outgoing screen and the incoming screen. Viewports were something I hadn’t had much experience with, however, so I wasn’t certain if the idea I had would actually work. To prove the concept, I spent a weekend creating a prototype specifically to test manipulating viewport and their render textures. The approach did, in fact, work as I envisioned (after a lot of research, trial, and error), so I proceeded to refactor the screen management system in Sanity Wars Reimagined to use this new approach.

When referring to screens here, I’m not talking about physical monitor screens; it’s a term I use to refer to a whole collection of elements comprising a section of the game experience. For instance, the Main Menu Screen is what you see on booting up the game, and Game Screen is where the gameplay takes place.

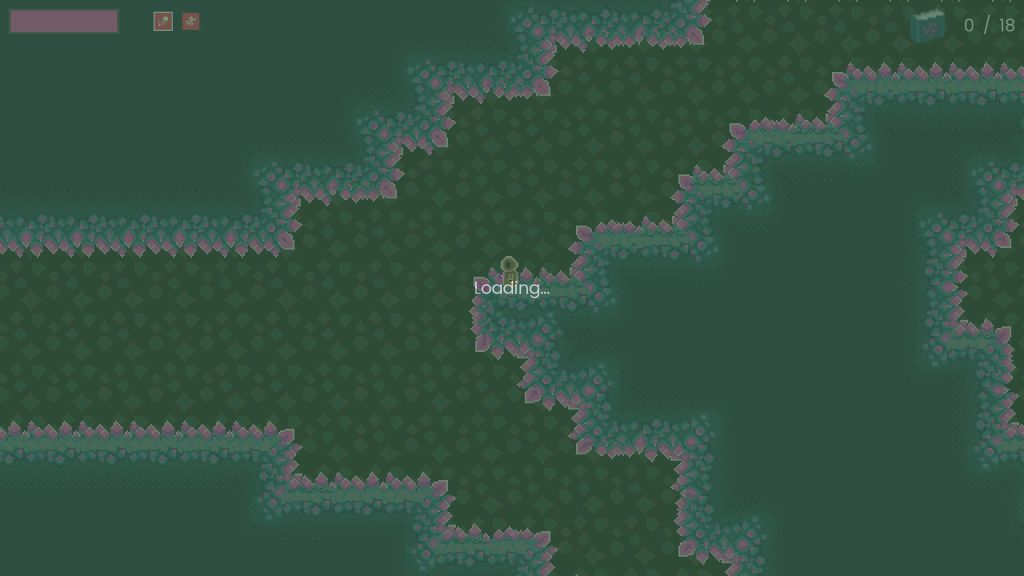
Overall, the refactor was an immense success. The fade effect worked precisely the way it did for the original Sanity Wars, and the system is flexible enough that I feel it should be easy enough to design new screen transition effects (in fact, I did create one as part of making the LoadingScreen, transitioning to an in-between screen that handled providing feedback to the user while the incoming GameScreen prepared the gameplay). Should I want to create different visual effects for future transitions, it should be as simple as writing a shader to handle it. (Not that shaders are simple, but it is far easier to do complex visual effects with shaders than with node property manipulation!)

Automated Export Script

After realizing that I needed to export game builds frequently (more on that later), I quickly found that it was tedious to have to work through Godot’s export interface every time I wanted to make a build. On top of that, Godot doesn’t have native build versioning (at least, not that I’ve found), so I have to manually name each exported build, and keep track of what the version number is. Needless to say, I wondered if there was a way I could automate this process, possibly through augmenting the Genesis scripting tools to include a simple command to export a project.

I took a few days to work through this, and in the end I managed to create functionality in my Genesis scripting tool that did what I wanted. With a simple command, godot-genesis export-project "Sanity Wars Reimagined" "Name Of Export Template", Genesis would handle grabbing a Godot executable and running a shell command to make Godot export the project using the provided export template, and then create a ZIP archive of the resulting export. The name of the export was the project name, followed by a build number using the semantics I chose (major.minor.patch.build). By providing a -b flag, I could also specify what kind of build this was (and thus which build number to increment). It works really well, and now that exports are so easy to do I am more willing to make them frequently, which allows me to quickly make sure my development changes work in the release builds.

Other Features and Improvements

There are many other features that were created for Sanity Wars Reimagined; to save time, I’ll simply give brief summaries of these. Some of these were not generalized enough to be ported back into the Genesis boilerplate, but the experience gained from creating them remains valuable nonetheless.

Generators

These nodes handle spawning entities, and I made the system flexible enough that I can pretty much generate any kind of object I want (though, in this case, I only used it to spawn Eyeballs and Tomes).

RectZone

This is a node which let me specify a rectangular area that other nodes (like Generators) could use to make spatial calculations against (aka figure out where to spawn things).

PixelPerfectCamera

This is a Camera node that was customized to support smoothing behavior rounded to pixel-perfect values. This helps reduce the amount of visual jitter that results from when a camera is positioned between whole integer values.

The reason this happens is because pixels can’t be rendered at fractional, non-integer values, so when a pixel art game asset is placed such that the underlying pixels don’t line up to a whole integer, the game engine’s renderer “guesses” what the actual pixel color values should be. This is barely noticeable for high-resolution assets because they consist of a huge number of pixels, but for something as low-resolution as pixel art, this results in visual artifacts that look terrible.

UI Theming

I finally took a dive into trying to understand how Godot’s theme system works, and as a result I was able to create themes for my UI that made it much simpler to create new UI elements that already worked with the visual design of the interface. I plan to build on my experience with UI themes for future projects, and ultimately want to make a base theme for the Genesis boilerplate, so I don’t have to create new themes from scratch.

State Machine Movement

I converted my previous Player character movement code to be based on a state machine instead of part of the node’s script, and this resulted in movement logic that was far simpler to control and modify.


As you can see, there were a lot of features I developed for Sanity Wars Reimagined, independent of gameplay aspects. A large part of what I created was generalized and reusable, so I can put the code in future projects without having to make modifications to remove Sanity Wars-specific functionality.

Complications

No human endeavor is perfect, and that is certainly true for Sanity Wars Reimagined. In fact, I made a lot of mistakes on this project. Fortunately, all of these mistakes are things I can learn from to make future projects better. I’ll highlight some of these issues and mistakes now.

Both Rebecca and I learned a lot from the mistakes we made developing this project, but I’m specifically focusing on my mistakes in this article.

New Systems Introduced New Complexities

The big systems I added, like Resolution Management and Screen Management, added lots of functionality to the game. With that, however, came gameplay issues that arose as the result of the requirements integrating with these systems introduced.

Take ScreenManager, for example. The system included the ability to have screens running visual updates during the transition, so the screen’s render texture didn’t look like it was frozen while fading from one screen to the next. By creating this capability, however, I needed to modify the existing game logic to take into account the idea that it could be running as part of a screen transition; for instance, the player character needed to be visible on the screen during the transition, but with input disabled so the player couldn’t move while the transition was running.

Another issue the ScreenManager refactor created had to do with resetting the game when the player chose to restart. Before, screens were loaded from file when being switched to, and being unloaded when switched from, so restart logic was as simple as using node _ready() methods to set up the game logic. After the refactor, this was no longer true; to avoid the loading penalty (and subsequent screen freeze) of dealing with loading scenes from file, ScreenManager instead kept inactive screens around in memory, adding them to the scene tree when being transitioned to and removing them from the scene tree when being transitioned from. Since _ready() only runs once, the first time a node enters the scene tree, it was no longer usable as a way to reset game logic. I had to fix this by explicitly creating reset functions that could be called in response to a reset signal emitted by the controlling screen, and throughout the remaining development I encountered bugs stemming from this change in game reset logic.

ResolutionManager, while allowing for crisp-looking UI, created its own problems as well. While the UI could be scaled down as much as I wanted, at smaller resolutions elements would render slightly differently from how they looked at 1920×1080. The reason for this was, ironically, similar to the issues with scaling pixel art: by scaling the UI down, any UI element whose size dimensions did not result in whole-number integers would force Godot’s renderer to have to guess what to render for a particular pixel location on the monitor. Subsequently, some of the UI looked bad at smaller resolutions (such as the outlines around the spell selection indicators). I suspect I could have addressed this issue by tweaking the UI design sizes to scale cleanly, but my attempts to change those values resulted in breaking the UI in ways I couldn’t figure out how to fix (largely due to my continued troubles understanding how to create good UI in Godot). In the end, I decided that, with my limited amount of time, trying to fix all the UI issues was less important than fixing the other issues I was working on, and ultimately the task was cut during the finishing stages of development.

I’m guessing most people won’t notice, anyway, since most people likely have the game at fullscreen, anyway.

Complexities arising from implementing new systems happened in other ways throughout the project as well, although the ones stemming from ScreenManager and ResolutionManager caused some of the bigger headaches. Fixing said issues contributed to extending development time.

Designing for Randomization

One of the core mechanics of Sanity Wars (original and Reimagined) is that all the entities in the game spawn at random locations on an unchanging set of maps. At the time I created the mechanic, my thought was that this was a way to achieve some amount of replayability, by having each run create different placements for the tomes, eyeballs, portals, and player.

Playtesters, however, pointed out that the fully random nature of where things spawned resulted in wide swings of gameplay experience. Sometimes, you got spawns that made runs trivially easy to complete; other times, the spawns made runs much more difficult. This had a negative impact on gameplay experience.

The way to solve this is through creating the means of controlling just how random the processes are. For example, I could add specific locations where portals were allowed to spawn, or add logic to ensure tomes didn’t spawn too close to portals. Adding controlled randomness isn’t easy, however, because by definition it means having to add special conditions to the spawning logic beyond simply picking a location within the map.

The biggest impact of controlled randomness wasn’t directly felt with Sanity Wars Reimagined, however; it was felt in our plans to expand directly off of this project for our next game. Given that random generation was a core element of gameplay, that meant adding additional elements would also need to employ controlled randomness, and that would likely result in a lot of work. On top of that, designing maps with randomness in mind is hard. It would likely take months just to prototype ideas, let alone flesh them out into complete mechanics.

This aspect, more than anything else, was a huge influence in our decision to not expand on Sanity Wars Reimagined for the next project, but to concentrate on a more linear experience. (More on that later.)

Clean Code

If you’re a programmer, you might be surprised at seeing “clean code” as a heading under complications. If you’re not a programmer, let me explain, very roughly, what clean code is: a mindset for writing code in such a way that it is easy to understand, has specific responsibilities, and avoids creating the same lines of code in different files; through these principles one’s code should be easier to comprehend and use throughout your codebase.

Under most circumstances, writing clean code is essential for making code not only easier to work with, but faster to develop. So how did writing clean code make Sanity Wars Reimagined more complex?

Simply put, the issue wasn’t strictly with adhering to clean code principles in and of themselves; the issue was when I spent a lot of time and effort coming up with clean code for flawed systems. Clean code doesn’t mean the things you create with it are perfect. In fact, in Sanity Wars Reimagined, some of the things I created wound up being harmful to the resulting gameplay.

A prime example of how this impacted development is the way I implemented movement for the Eyeball entity. I had the thought of creating a steering behavior-based movement system; rather than giving the entity a point to navigate to and allowing it to move straight there, I wanted to have the entity behave more like real things might move (to put it in very simple terms). I then spent a long time creating a locomotion system that used steering behaviors, trying to make it as clean as possible.

In the end, my efforts to integrate steering behavior movement were successful. There was a huge flaw, however; the movement hampered gameplay. Steering behaviors, by design, are intended to give less-predictable behavior to the human eye, which makes it harder to predict how the eyeball is going to move when it isn’t going in a straight line. This style of movement also meant the Eyeballs could easily get in a position where it was difficult for the player to hit them with the straight-line spirit bullet projectile, which was specifically intended for destroying Eyeballs. Since steering behaviors work by applying forces, rather than explicitly providing movement direction, there wasn’t an easy, feasible way for me to tweak the movement to make it easier for the player to engage with Eyeballs.

In addition to making Eyeballs less fun to play against, the steering behaviors also made it hard to make Eyeballs move in very specific ways. When I was trying to create a dive attack for the Eyeball, I literally had to hack in movement behavior that circumvented the steering behaviors to try and get the attack to visually look the way I wanted to; even then, I still had a lot of trouble getting the movement to look how I felt it should.

How did clean code contribute to this, precisely? Well, I’d spent a lot of time creating the locomotor system and making it as clean an implementation as I possibly could, before throwing it into the gameplay arena to be tested out and refined. If there had been time to do so, I likely would have needed to go back and refactor the Eyeball movement to not use steering behaviors; all that work I’d spent making the steering behavior implementation nice and clean would’ve gone to waste.

Don’t get me wrong; writing clean code is very important, and there is definitely a place for it in game development. The time for that, however, is not while figuring out if the gameplay works; there’s no sense in making something clean if you’re going to end up throwing it out shortly thereafter.

Playtesting

I didn’t let other people playtest the game until way too late in development. Not only did that result in not detecting crashes in release builds, it also meant I ran out of time to properly take feedback from the playtests and incorporate it back into the game.

For the first three months of development, I never created a single release build of Sanity Wars Reimagined. I kept plugging away in development builds. The first time I attempted exporting the project was the day, no, the evening I was scheduled to bring the game to a live-streamed playtest session with IGDA Twin Cities. As a result, it wasn’t until two hours before showtime that I found out that my release builds crashed on load. I spent a frantic hour hack-fixing the things causing the crashes, but even with that, the release build still had a major, game-breaking bug in it: the testers couldn’t complete the game because no portals spawned. Without being able to complete the game, the testers couldn’t give me good feedback on how the game felt to them. From that point onward, I made a point of testing exports regularly so that something like that wouldn’t catch me off-guard again.

The next time I brought the game out for playtesting was in the middle of January 2022, three months after the first playtest. At that point, I’d resigned myself to the fact that Sanity Wars Reimagined didn’t feel fun, and was likely going to be released that way; my intent with attending the playtest was to have people play the game and help me make sure I didn’t have any showstopping bugs I’d need to fix before release. What I wasn’t expecting (and, in retrospect, that was silly of me) was that people had a lot to say about the game design and ways it could be made more fun.

To be honest, I think I’d been stuck so long on the idea that I wanted to faithfully recreate the original game’s mechanics that I didn’t even think about making changes to them. After hearing the feedback, however, I decided that it would be more important to make the game as fun as I could before release, rather than sticking to the original mechanics.

That playtest, however, was one and a half weeks before the planned release date, meaning that I had very little time to attempt making changes of any significance. I did what I could, however. Some of the things I changed included:

  • Removing the sacrifice aspect of using spells. Players could now access spells right away, without having to sacrifice their maximum sanity.
  • Giving both the spells dedicated hotkeys, to make them easier (and thus more likely) to be used.
  • Adding a countdown timer, in the form of reducing the player’s maximum sanity every so often, until the amount was reduced to zero, killing the player. This gave players a sense of urgency that they needed to resolve, which was more interesting than simply exploring the maps with no time constraints.
  • Changing the Eyeball’s attack to something that clearly telegraphed it was attacking the player, which also made them more fun to interact with.
  • Adding a scoring system, to give the player something more interesting to do than simply collecting tomes and finding the exit portal.
  • Various small elements to add juice to the game and make it feel more fun.

Although we did wind up extending the release date by a week (because of dealing with being sick on the intended release week), I was surprised with just how much positive change I was able to introduce in essentially two and a half weeks’ worth of time. I had to sacrifice a lot of clean code principles to do it (feeding into my observation about how doing clean code too early was a problem), but the end result was an experience that was far more fun than it was prior to that play test.

I can only imagine how much more fun the game could’ve been if I’d had people involved with playtesting in the early stages of development, when it would’ve been easier to change core mechanics in response to suggestions.

Thanks to the IGDA Twin Cities playtest group, and specifically Mark LaCroix, Dale LaCroix, and Lane Davis, for offering many of the suggested changes that made it into the final game. Thanks also to Mark, Lane, Patrick Grout, and Peter Shimeall for offering their time to playtest these changes prior to the game’s release.

Lack of a Schedule

I mentioned previously that I’d thought the entire Sanity Wars Reimagined project wouldn’t take more than a month, but I hadn’t actually established a firm deadline for when the project needed to be done. I tried to implement an approach where we’d work on the project “until it felt ready”. I knew deadlines were a way that crunch could be introduced, and I wanted to avoid putting ourselves in a situation where we felt we needed to crunch to make a deadline.

The downside, however, was that there wasn’t any target to shoot for. Frequently, while working on mind-numbing, boring sections of code, I had the dread fear that we could wind up spending many more months on this project before it would be finished. This fear grew significantly the longer I spent working on the project, my initial month-long estimate flying by the wayside like mile markers on a highway.

Finally, out of exasperation, I made the decision to set a release date. Originally, the target was the middle of December 2021, but the game wasn’t anywhere near bug-free enough by that point, so we pivoted to the end of January 2022, instead. As that deadline approached, there were still dozens upon dozens of tasks that had yet to be started. Instead of pushing the deadline out again, however, I went through the list to determine what was truly essential for the game’s release, cancelling every task that failed to meet that criteria.

Things that hit the cutting room floor include:

  • Adding a second enemy to the game, which would’ve been some form of ground unit.
  • Refactoring the player’s jump to feel better.
  • Fixing a bug that caused the jump sound to sometimes not play when it should.
  • Adding keyboard navigation to menus (meaning you had to use the mouse to click on buttons and such).
  • Create maps specifically for the release (the ones in the final build are the same as the ones made for the second playtest).

It’s not that these things wouldn’t have improved the game experience; it’s just that they weren’t essential to the game experience, or at least not enough to make it worth extending the release date to incorporate them. By this point, my goal was to finish the game and move on to the next project, where, hopefully, I could do a better job and learn from my mistakes.


These are far from the only complexities that we had to deal with during Sanity Wars Reimagined, but they should serve to prove that a lot of issues were encountered, and a lot of mistakes were made. All of these things, however, are learning opportunities, and we’re excited to improve on the next project.

Improvements for Next Time

There’s a lot of things that I want to try for the next project; many of them serve as attempts to address issues that arose during the development of Sanity Wars Reimagined.

Have A Planned Release Date

I don’t want to feel like there’s no end in sight to the next project, so I fully intend to set a release date target. Will we hit that target? Probably not; I’m not a great estimator, and life tends to throw plenty of curveballs that wreak havoc on plans. By setting an end goal, however, I expect that it will force us to more carefully plan what features we want to try and make for the next game.

In tandem with that, I want to try and establish something closer to a traditional game development pipeline (or, at least, what I understand of one), with multiple clearly-defined phases: prototyping, MVP, alpha, beta, and release. This will hopefully result in lots of experimentation up front that settles into a set of core mechanics, upon which we build lots of content that is rigorously tested prior to release.

Prototype Quickly Instead of Cleanly

Admittedly, the idea of not focusing on making my code clean rankles me a bit, as a developer, but it’s clear that development moves faster when I spend less time being picky about how my code is written. Plus, if I’m going to write something, find out it doesn’t work, and throw it away, I want to figure that out as quickly as possible so I can move on to trying the next idea.

Thus, during the prototyping phase of the next project, I’ll try to not put an emphasis on making the code clean. I won’t try to write messy code, of course, but I’m not going to spend hours figuring out the most ideal way to structure something. That can wait until the core mechanics have been settled on, having been playtested to confirm that said mechanics are fun.

Playtest Sooner Rather Than Later

The feedback I received from the final big playtesting session of Sanity Wars Reimagined was crucial in determining how to make the game more fun before release. For the next project, I don’t want to wait that long to find out what’s working, what’s not, and what I could add to make things even more fun.

I don’t think I’ll take it to public playtesting right away, but I’ll for sure reach out to friends and interested parties and ask them to try out prototype and MVP builds. It should hopefully be much easier to make suggested changes during those early stages, versus the week before release. With more frequent feedback, I can also iterate on things more often, and get the mechanics to be fun before locking them down and creating content for them.

Make a Linear Experience

After realizing how much work it would be to try and craft a good random experience, I’ve decided that I’m going to purposely make the next game a linear experience. In other words, each playthrough of the game won’t have randomness factoring into the gameplay experience. This may be a little more “boring”, but I think doing it this way will make it easier for me to not only practice making good game design, but make good code and good content for as well.

Will it be significantly less fun than something that introduces random elements to the design? Maybe, maybe not. We’ll find out after I attempt it!


Those are just a few of the things I intend to try on the next project. I don’t know if all of the ideas will prove useful in the long run, but they at least make sense to me in the moment. That’s good enough, for now. Whatever we get wrong, we can always iterate on!

Conclusion

That’s the story of Sanity Wars Reimagined. We started the project as an attempt to make a quick release to gain experience creating games, and despite taking significantly longer than planned, and the numerous mistakes made along the way, we still wound up releasing the game. Along the way, we developed numerous technologies, and learned lots of lessons, that should prove immensely useful for our next project. Because of that, despite the resulting game not being as fun as I wish it could’ve been, I consider Sanity Wars Reimagined a success.

What’s next for Rebecca and I? It’ll for sure be another platformer, as that will allow us to make good use of the technologies and processes we’ve already developed for making such games. I fully expect there will be new challenges and complications to tackle over the course of this next project, and I can’t wait to create solutions for them, and learn from whatever mistakes we make!

Sanity Wars Reimagined released!

The game PixelLunatic and I have been working on for the past seven months, Sanity Wars Reimagined, has been officially released! Download it here.

It’s been a long seven months, working on this game, and while there’s still plenty of things that could be improved, overall I’m pleased with how this game turned out. Most importantly, we learned many things that will prove useful for our future game development endeavors.

We hope you enjoy our game!

Implementing the Messenger Pattern in Godot

Note: If you implemented this pattern and are now experiencing issues with get_tree() calls, see my Issues with get_tree() section at the end of the article.

Oftentimes, in code, you need a way to have different parts of the codebase communicate with each other. One way to do this is have those components directly call methods from another component. While that works, it means you directly couple those components together. If you want to reuse one component in another project, you either have to take all the directly-coupled components with it or you have to refactor the direct couplings out of the component you want to reuse, neither of which is desirable from a clean code standpoint.

A way to solve this problem is to use the signal pattern. This is where each component can emit a named signal, and other components can then be connected to that signal. From that point on, whenever that signal is emitted by the component, anything that is listening for that signal can run code in response to that emission. It’s generally a great pattern, allowing for code to indicate when some event, or signal, happens, and for other parts of code to respond to that event accordingly (without code directly relying on calling methods from one another).

There is a third way to have decoupled components communicate to one another: the messenger pattern. At surface level, it’s very similar to the signal pattern: a part of your code dispatches a named message, and any code that is listening for that particular message can respond to it. Those different parts of your code aren’t connected to one another, however; instead, they interact through a Messenger node. Code that wants to listen for a message registers a message listener to the Messenger, and when another part of code dispatches a message with that name, the Messenger loops through all the registered listeners for that message name and invokes their callback functions.

Both the signal pattern and the messenger pattern can be considered subsets of the Observer pattern. The key difference is that the signal pattern has many objects connecting to one (the object emitting the signal), while the messenger pattern has a mediator object through which messages are dispatched and listened for by other objects. Which is better? It depends on what you are trying to accomplish architecturally, and there’s no reason you can’t use both.

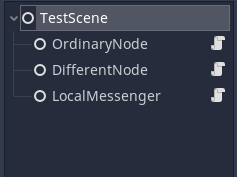
Let’s discuss specifics, with relation to what Godot uses. Godot has the signal pattern baked into it at the core. Nodes can define signals through use of the signal keyword. Any node that wants to listen for another node’s signal can connect() to that node’s signal and associate a callback function to it. It looks like this, at a simplified level:


# OrdinaryNode
extends Node
signal some_cool_thing

# DifferentNode
extends Node

func _ready():
  # Assuming both OrdinaryNode and DifferentNode are children of a hypothetical parent node.
  get_parent().get_node('OrdinaryNode').connect('some_cool_thing', self, '_do_something_awesome')

func _do_something_awesome():
  print("This is awesome!")

From then on, whenever OrdinaryNode emits the some_cool_thing signal, the _do_something_awesome() function in DifferentNode will run, printing “This is awesome!”

While this is a good implementation of signals, the nature of how the signal pattern works implies some shortcomings. For instance, all signals must be explicitly defined in code. You can’t have OrdinaryNode, as written above, emit a coffee_break signal because the code didn’t explicitly define that such a signal exists. This is by design, as it means you have to plan what your node can and can’t emit. Sometimes, though, you do want to have a more flexible way to communicate with other nodes, and at that point signals can’t help you. This is one thing the messenger pattern can help with, by not requiring you to explicitly define what messages can or can’t be sent.

Another aspect of the signal pattern is that it requires you to have nodes define a connection to the node emitting the signal if you want those nodes to react to the signal. That means those nodes must, by definition, couple themselves to the node emitting the signal (though the emitter node doesn’t know, or care, about those couplings). This isn’t necessarily bad, but it limits how you can architect your code; you have to make sure nodes that need to listen for a specific signal are able to connect to the node emitting said signal. Conversely, using the messenger pattern, you can have nodes connect only to a single Messenger node, which can be simpler to implement.

Godot does not natively implement such a messenger node, however. If we want to use this messenger pattern, we’ll need to make something ourselves. That’s what this tutorial will be about.

Note: What I’m calling the Messenger Pattern is more commonly known as the Mediator Pattern. I came up with the name Messenger before I learned what it is called, and I’ll continue to use it in this tutorial because I think it communicates more clearly what I’m using it for.

Setting Up

There is a sample project, if you want to refer to the finished product.

If you want to code alongside the tutorial, start by creating a new Godot project, then create a GDScript file named Messenger.gd. We’ll make this as the base file that other implementations of messengers can extend to provide their own functionality.

The original project was created in Godot 3. Here is a branch that is configured for Godot 4. (Thanks to valVk for assisting the Godot 4 conversion!)

Adding and Removing Listeners

The first thing we want to do is provide a way to add and remove message listeners. Let’s begin with adding listeners.


var _message_listeners := {} # Stores nodes that are listening for messages.


# Add object as a listener for the specified message.
func add_listener(message_name: String, object: Object, method_name: String) -> void:
  var listener = { 'object': object, 'object_id': object.get_instance_id(), 'method_name': method_name }
  
  if _message_listeners.has(message_name) == false:
    _message_listeners[message_name] = {}
  
  _message_listeners[message_name][object.get_instance_id()] = listener

This is fairly straightforward. We take the name of the message, the object that has the callback function, and the name of the callback. We store all that in a listener dictionary (defined as a class property outside of the function) and store it in _message_listeners in the dictionary stored at the key matching the message name (creating a dictionary for that key if it doesn’t already exist). We key this listener in the message_name dictionary to the object’s instance id, which is guaranteed to be unique.

Since Godot implements signals at the object level (Node inherits from Object), I’ll be typing these as Objects rather than Nodes, which allows for any node inheriting from Object to be used as a listener (including Resources).

Next, the ability to remove a registered listener.


# Remove object from listening for the specified message.
func remove_listener(message_name: String, object: Object) -> void:
  if not _message_listeners.has(message_name):
    return
  
  if _message_listeners[message_name].has(object.get_instance_id()):
    _message_listeners[message_name].erase(object.get_instance_id())
  
  if _message_listeners[message_name].empty():
    _message_listeners.erase(message_name)

Again, fairly straightforward. We run existence checks to see if a listener exists at that message_name key, and erase it from the dictionary if so. Additionally, if no more listeners exist for that message_name, we erase the dictionary for listeners of that message name.

Sending Messages

Now that we can add and remove message listeners, it’s time to add the ability to send those messages.


# Sends a message and triggers _callbacks on its listeners.
func dispatch_message(message_name: String, data := {}) -> void:
  var message = { 'name': message_name, 'data': data }

  _process_message_listeners(message)

We take a message_name string and a data dictionary (which defaults to be an empty dictionary), store it to a message variable, and pass that variable into _process_message_listeners.


# Invoke all listener callbacks for specified message.
func _process_message_listeners(message: Dictionary) -> void:
  var message_name = message.name
  
  # If there aren't any listeners for this message name, we can return early.
  if not _message_listeners.has(message_name):
    return
  
  # Loop through all listeners of the message and invoke their callback.
  var listeners = _message_listeners[message_name]
  for listener in listeners.values():
    # Invoke the callback.
    listener.object.call(listener.method_name, message.data)

This is where we handle triggering the callbacks for a message listener. If there aren’t any listeners for that message name, we return early to avoid doing further processing. If there are listeners for that message name, then we loop through each one and trigger the stored method callback, passing in the message’s data dictionary.

That’s it, as far as the basic implementation goes. But there are a couple of caveats that need to be dealt with.

Dealing with Nonexistent Listeners

One such case happens when a listener’s object is freed, making the stored reference in the listener dictionary invalid. If you try to operate on it, Godot will crash, so we need to provide a way to scan for dead listeners and remove them from storage.

Let’s start with a function to perform both the check and the purge:


# Removes a listener if it no longer exists, and returns whether the listener was removed.
func _purge_listener(listeners: Dictionary, listener: Dictionary) -> bool:
  var object_exists = !!weakref(listener.node).get_ref() and is_instance_valid(listener.node)
    
  if !object_exists or listener.node.get_instance_id() != listener.node_id:
    listeners.erase(listener.node_id)
    return true

  return false

Multiple checks are used to see if the object exists (I’ve found in practice that I’ve needed both of these, not just one or the other). We also check to see if the instance id of the stored listener matches the id of the listener object we passed in; honestly, I can’t recall when or why that particular scenario occurs (I sadly forgot to write a comment about it in my code), but I know I’ve encountered it in the past, so I continue to include it as part of my check. If the object doesn’t exist, or the ids don’t match, we conclude the listener’s object no longer exists, and thus remove the listener from storage. Finally, we return a boolean value indicating whether the purge was performed or not.

Now we need to modify our existing code to use this function.


func _process_message_listeners(message: Dictionary) -> void:
  # ...existing logic
  
  for listener in listeners.values():
    # If the listener has been freed, remove it
    if _purge_listener(listeners, listener):
      # Check if there are any remaining listeners, and erase the message_name from listeners if so.
      if not _message_listeners.has(message_name):
        _message_listeners.erase(message_name)
        return
      else:
        continue

    # ...existing logic

The difference is we call _purge_listener before we try to invoke the callback. If the listener was purged, we perform an additional check to see if there are any other listeners of message_name, and erase the dictionary keyed to message_name if there aren’t; otherwise, we proceed to the next listener in the for loop.

That takes care of dead listeners. There’s one more problem we need to address.

Dispatching Messages Too Early

Right now, if we try to send and listen for messages during the ready process (when Godot’s nodes all run their _ready callbacks), then we’ll likely run into issues where messages are dispatched before the listeners of those messages are registered (because their ready callbacks run later than when the messages are sent). To solve this, we’re going to add a message queue. If a message is being dispatched before the root node of the scene tree is ready, we’ll add the message onto this queue, and once the root node emits its ready signal we’ll process all the messages in the queue.

Let’s start with setting up the message queue, and modifying our dispatch_message function.


var _message_queue := [] # Stores messages that are being deferred until the next physics process tick.
var _messenger_ready := false # Is set to true once the root node is ready, indicating the messenger is ready to process messages.

# Sends a message and triggers _callbacks on its listeners.
func dispatch_message(message_name: String, data := {}) -> void:
  var message = { 'name': message_name, 'data': data }

  if _messenger_ready:
    _process_message_listeners(message)
  else:
    _message_queue.push_back(message)

We’ve added two new class properties, one to house the message queue and the other to mark when the messenger node considers itself ready. dispatch_message has been modified to first check _messenger_ready, and if so it runs the code the same as before. If the messenger node is not ready, then the message is pushed onto the message queue.

Now let’s set up the ability to process the message queue.


func _ready() -> void:
  get_tree().get_root().connect('ready', self, '_on_Root_ready')


# Is called when the root node of the main scene tree emits the ready signal.
func _on_Root_ready() -> void:
  _messenger_ready = true
  _process_message_queue()


# Process all messages in the message queue and reset the queue to an empty array.
func _process_message_queue() -> void:
  for message in _message_queue:
    _process_message_listeners(message)
  
  _message_queue = []

In Messenger’s own _ready callback, we register a listener to the scene tree root’s ready signal. The callback then sets _messenger_ready to true and calls a function, _process_message_queue(), which loops through each message in the queue and calls _process_message_listeners() on them. At the send, we clear the message queue, since we don’t need (or want) to process these messages again.

Creating a GlobalMessenger

At this point, we have a base Messenger class that can be used anytime we want to implement the messenger pattern in our code. Let’s demonstrate this by creating a global singleton, GlobalMessenger, that we can interact with from anywhere in our codebase.

Start by creating a new file, global_messenger.gd, and have it extend our Messenger class. If Godot claims the Messenger class doesn’t exist, then you’ll need to reload the project to force Godot to update itself and recognize the Messenger class we added in Messenger.gd.


# Creates a global messenger that can be accessed from anywhere in the program.
extends Messenger

The reason I made this file name snake_case is because my personal convention is to name files that are solely used as singletons with this format, to distinguish them from files containing extensible classes. This is my personal preference only, and is not required to make this code work.

That’s all that needs to be done from a code standpoint. To make this a globally-available singleton, we need to go to Project -> Settings in the editor menu, navigate to the AutoLoad tab, and add global_messenger.gd to the list of autoloaded files.

And…that’s it! We now have a global singleton that we can use from anywhere in our codebase to dispatch messages!

Deferring Messages

Let’s add some additional functionality to our global messenger. For instance, right now, once the messenger is ready, we immediately run listener callbacks upon receipt of the message. What if we wanted to defer message dispatches until the next process tick? It might prove useful to ensure all game data is updated by the time your message callbacks are being run.

We already have a message queue that is used to make sure messages are deferred until the messenger is ready. We can build on that to add functionality to intentionally defer message dispatching until the next physics process tick.


func _ready() -> void:
  set_physics_process(false)


func _physics_process(_delta) -> void:
  ._process_message_queue()
  set_physics_process(false) # We don't need to keep updating once messages are processed.


# Queues a message to be dispatched on the next physics processing tick.
func dispatch_message_deferred(message_name: String, data := {}) -> void:
  _message_queue.push_back({ 'name': message_name, 'data': data })
  
  set_physics_process(true)

First, we use _ready() to disable physics processing. That’s because, whenever _physics_process() is defined in a script file, Godot automatically enables processing. We only want to process when there are messages in queue, so we just disable physics processing right off the bat.

I use _physics_process instead of _process to ensure messages are processed at a consistent rate. physics_process is run a consistent amount of times per second, whereas _process is run as often as possible, and I’ve found that having messages processed as fast as possible can result in unexpected complexity when sent from code that is expecting a consistent frame rate.

Next, in the _physics_process() callback, we call _process_message_queue(), then disable physics processing again (basically, only running the update step a single time).

Finally, we create a new function, dispatch_message_deferred, making it obvious that calling this will be different from a regular message dispatch. We add the message straight onto the message queue. Afterwards, we set the physics processing step to be true. This way, the next time _physics_process() callbacks are run in the code, the global messenger’s _physics_process() callback will be run, too. And since it is a global singleton, it will be run before other nodes in the root scene.

That’s it!

Testing our Implementation

Now that we have a Messenger node, and a GlobalMessenger implementation of it, let’s set up a test scene in our project to test their functionality and make sure they work as intended.

Create a new scene, TestScene, then structure it thusly:

LocalMessenger is a node which is extended from Messenger; we will use this to test that a locally-built implementation of our messenger node works.

The other two nodes, OrdinaryNode and DifferentNode, should contain the following code:


# OrdinaryNode
extends Node


onready var localMessenger = $"../LocalMessenger"


func _ready() -> void:
  GlobalMessenger.dispatch_message('test_1', { 'fish': 'shark' })
  localMessenger.add_listener('test_local', self, '_on_Test_local')


func _on_Test_local(data) -> void:
  print('Do you like looking at the ', data.animal, '?')
  
# DifferentNode
extends Node


onready var localMessenger = $"../LocalMessenger"


func _ready() -> void:
  GlobalMessenger.add_listener('test_1', self, '_on_Test_1')
  localMessenger.dispatch_message('test_local', { 'animal': 'rabbit' })


func _on_Test_1(_data) -> void:
  print('Test 1 received')

At this point, if you run the scene, you should see the two messages printed to console. If you do, then everything was set up correctly!

Issues with get_tree()

Recently (in May 2023), I encountered a strange bug where a message callback that invoked get_tree() was not returning the scene tree, despite the node housing the callback function being in the scene tree. After some investigation, I realized that I was calling the add_listener() function from the node’s _ready() callback; when I switched to adding the listener in _enter_tree() and removing it in _exit_tree() the get_tree() call worked as expected.

I admittedly am not entirely sure why this works, but my theory is that adding the listener during _ready() is either storing the reference to the function call when the tree is not yet defined or subsequent tree exits and enters is causing the reference to be lost. In any case, I wanted to add this addendum in case anyone else chose to implement this pattern and ran into the same problem.

If you happen to know more info about why this might have happened, please let me know!

Conclusion

We now have a base Messenger node, as well as a GlobalMessenger singleton that extends it and adds defer functionality to it. When should it be used? Personally, I use the messenger pattern in cases where I want to enable node communication, but for whatever reason it doesn’t benefit me to define the specific signals ahead of time, which is when the messenger’s dynamism comes into play.

Of course, that dynamism leads to the risk of making messy code. One advantage to explicitly forcing signals to be defined is that it forces you to think about how you are architecting your code, by making you think clearly about how your signals are going to be used. Since Messenger lets any node send whatever message it wants, it falls on you to make sure that power isn’t abused to send messages when the situation doesn’t call for it. For instance, if you have one node which you want other nearby nodes to listen for a specific event from, you don’t need the dynamic nature of Messenger; signals work perfectly fine, and are a cleaner way to get the job done.

As with all things, in life and code, consider carefully how you do things, and use whatever tools and patterns best fit your needs.

Creating a Debugging Interface in Godot (Part 3)

Welcome to Part 3 of my tutorial for creating a debugging interface in Godot! In Part 1, we created the base for our debugging system, and in Part 2 we created debug widgets to show our debugging information. If you haven’t read those parts, you would be advised to do so before continuing on with this part. Alternatively, if you want to start from this part, and just need the end code from the preceding parts, you can check out the tutorial-part-2 branch from the Github repo.

At this point, we have a debugging interface that we can toggle on and off, and we have a base DebugWidget class to build our debug widget from, as well as a DebugTextList debug widget. We don’t quite have everything we’d ideally want in a debugging system, though. What happens if we want to display different debug widgets, and not have to see all of them at the same time? What if we have a lot of debug widgets, so much so that they take up most of the screen space, making it impossible to see the underlying game beneath the cluttered visuals?

We could try creating multiple DebugLayer nodes, but this would quickly become brittle and clunky. As the DebugLayer is exposed globally for our code to access, any additional DebugLayer nodes would also need to be global, which would pollute the AutoLoad declarations. It would also mean having to remember which DebugLayer you’re connecting to, as well as assigning different keys to show and hide each layer so that they don’t all show at the same time… Suffice it to say, doing things this way is awful.

It would be better to create a system specifically for showing different debugging interfaces, depending on whatever criteria we choose to specify. We’ll do this by creating a new type of node, the DebugContainer, and modifying DebugLayer to be capable of managing multiple DebugContainer nodes.

If you want to see the final result, you can check out the tutorial-part-3 branch in the Github repo.

Ready? Let’s go!

Creating the DebugContainer

Begin by creating a new script file, DebugContainer.gd, in the _debug directory. Have it extend MarginContainer. We’ll begin by adding this line of code:


# The list of widget keywords associated with the DebugContainer.
var _widget_keywords = {}

Wait a minute, you say. That looks suspiciously like the code we added to DebugLayer.gd in the previous part of this tutorial. Well, you’re right! That’s exactly what it is. Our goal is to move management of individual DebugWidget nodes out of DebugLayer and into DebugContainer nodes, so it makes sense to go ahead and store the widget keywords here.

Moving Widget Code from DebugLayer to DebugContainer

In fact, we’re going to move most of the code we added to DebugLayer for managing debug widgets into DebugContainer.gd. Let’s take care of that right now:


func _ready():
    mouse_filter = MOUSE_FILTER_IGNORE
    _register_debug_widgets(self)
    Debug.register_debug_container(self)


# Adds a widget keyword to the registry.
func _add_widget_keyword(widget_keyword: String, widget_node: Node) -> void:
  var widget_node_name = widget_node.name if 'name' in widget_node else str(widget_node)

  if not _widget_keywords.has(widget_node_name):
    _widget_keywords[widget_node_name] = {}

  if not _widget_keywords[widget_node_name].has(widget_keyword):
    _widget_keywords[widget_node_name][widget_keyword] = widget_node
  else:
    var widget = _widget_keywords[widget_node_name][widget_keyword]
    var widget_name = widget.name if 'name' in widget else str(widget)
    push_error('DebugContainer._add_widget_keyword(): Widget keyword "' + widget_node_name + '.' + widget_keyword + '" already exists (' + widget_name + ')')
    return


# Go through all children of provided node and register any DebugWidgets found.
func _register_debug_widgets(node) -> void:
  for child in node.get_children():
    if child is DebugWidget:
      register_debug_widget(child)
    elif child.get_child_count() > 0:
      _register_debug_widgets(child)


# Register a single DebugWidget to the DebugContainer.
func register_debug_widget(widgetNode) -> void:
  for widget_keyword in widgetNode.get_widget_keywords():
    _add_widget_keyword(widget_keyword, widgetNode)


# Sends data to the widget with widget_name, triggering the callback for widget_keyword.
func update_widget(widget_path: String, data) -> void:
  var split_widget_path = widget_path.split('.')
  if split_widget_path.size() == 1 or split_widget_path.size() > 2:
    push_error('DebugContainer.update_widget(): widget_path formatted incorrectly. ("' + widget_path + '")')

  var widget_name = split_widget_path[0]
  var widget_keyword = split_widget_path[1]

  if _widget_keywords.has(widget_name) and _widget_keywords[widget_name].has(widget_keyword):
    _widget_keywords[widget_name][widget_keyword].handle_callback(widget_keyword, data)
  else:
    push_error('DebugContainer.update_widget(): Widget name and keyword "' + widget_name + '.' + widget_keyword  + '" not found (' + str(_widget_keywords) + ')')

Almost all of the code above is code we worked on in Part 2 of this tutorial. If you need any refreshers on how that code works, feel free to review that part.

There are a couple of differences to the code that need to be pointed out; both are in the _ready() function. First, the mouse_filter = MOUSE_FILTER_IGNORE line.

By default, mouse_filter is equal to MOUSE_FILTER_PASS. That value means that, when you render a UI node, mouse interactions are captured by the first UI element that decides to handle it. If you have two UI nodes, and you click on that stack, the “top” node will receive the mouse event first. If it doesn’t handle the event, it gets passed to any nodes below it. If it does do something with the event, however, then the event is considered to be handled, and is no longer passed on to other nodes.

With that information, let’s think about how our debugging system is implemented. We made DebugLayer a CanvasLayer node that is rendered at the highest level possible. Because of this, anything in DebugLayer will receive mouse events before anything else in the game. Since control nodes default to using the MOUSE_FILTER_PASS setting, that means DebugLayer will consume any mouse events while it is being shown, preventing interaction with the underlying game. That is behavior we definitely don’t want. That is why we set mouse_filter to MOUSE_FILTER_IGNORE for DebugContainer, so that it will ignore any mouse events, allowing them to proceed down to the underlying game nodes.

The other thing to note about the code we’re adding is the call to Debug.register_debug_container(). This will be how our debug container registers itself with the DebugLayer, much like what we did with debug widgets in the previous part of the tutorial.

If you’re copying code over from your project, don’t forget to update the error messaging and code documentation to say DebugContainer instead of DebugLayer.

Modifying DebugLayer to use DebugContainers

We’re going to need to add register_debug_container() to DebugLayer.gd. Before we do so, however, we need to make some other changes to the DebugLayer scene, itself:

  • Remove the TextList1 node we created in the previous tutorial; we’re no longer going to store debug widgets directly in the DebugLayer scene.
  • Select the DebugUIContainer node, click on the Layout tab, and select “Full Screen”.
  • Add a VBoxContainer child to DebugUIContainer.
  • Add a Tabs node and a MarginContainer node as children of the VBoxContainer (in that order).
  • Name those last two nodes DebugTabs and DebugContentContainer.
  • Go to the DebugTabs node properties and set Tab Alignment to left.

That takes care of the scene. Let’s move on to modifying the script. If you haven’t done so already, remove the code implementing debug widgets in DebugLayer (aka the stuff we moved into DebugContainer). Once that’s done, add the register_debug_container() function and the related code that is part of its implementation:


signal debug_container_registered


# The debug containers registered to the DebugLayer.
var _debug_containers = {}

# The currently active debug container.
var _debugContainer: Node

# Nodes implementing the debug container tab switching interface.
onready var debugTabs = $DebugUIContainer/VBoxContainer/DebugTabs
onready var debugContentContainer = $DebugUIContainer/VBoxContainer/DebugContentContainer


func _input(_event) -> void:
  if Input.is_action_just_pressed('toggle_debug_interface'):
    # ...existing code 
    _debugContainer.show()


func register_debug_container(containerNode) -> void:
  var container_name = containerNode.name
  if _debug_containers.has(container_name):
    push_error('DebugLayer.register_debug_container: Debug already has registered DebugContainer with name "' + container_name + '".')
    return

  # Reparent the container node to the DebugLayer.
  containerNode.get_parent().call_deferred('remove_child', containerNode)
  debugContentContainer.call_deferred('add_child', containerNode)
  debugTabs.add_tab(container_name)

  _debug_containers[container_name] = containerNode
  if _debug_containers.size() == 1:
    _debugContainer = containerNode

  # Hide this container node so we don't show debug info by default.
  containerNode.hide()

  emit_signal('debug_container_registered', containerNode)

That’s quite a chunk of code. Let’s unpack this and see what everything does.

First, we add a signal, debug_container_registered, which we’ll dispatch whenever a debug container is registered. Next, we add _debug_containers, which will be used the same way that we used _debug_widgets, just for debug containers instead of debug widgets. We also add _debugContainer to keep track of the currently shown debug container’s node.

We define references for two of the UI nodes we added to the DebugLayer scene, debugTabs and debugContentContainer. For now, we’ll ignore these in favor of explaining other parts of the added code. Don’t worry, we’ll explain what these nodes are used for as we progress through the tutorial.

Continuing on, we modify our _input() function to show the current debug container node whenever we toggle on the debug interface. And finally, at long last, we have the register_debug_container() function, itself.

In register_debug_container(), we first get the name of the passed-in containerNode and check to see if that name is already registered; if it is, we show an error and return without doing anything else. Next, we need to reparent the containerNode from wherever it currently is in the scene tree to become a child of debugContentContainer. Note the use of call_deferred(), rather than invoking the functions directly; this calls the specified functions during Godot’s idle time, which prevents issues that can occur when running code within nodes that are being reparented.

We’re going to allow DebugContainer nodes to be added pretty much wherever we want when creating our scenes, so we need to move them inside the DebugLayer at runtime to ensure they get displayed as part of the debugging interface. This should make more sense once we get to the part where we start using debug containers.

After the reparenting is finished, we add a new tab to the DebugTabs node, entitled the debug container’s name. Then we add the containerNode to the dictionary of debug containers; if it’s the first debug container we’ve registered, we set it to be the initially-shown debug container. We want to make sure that our debug containers aren’t visible by default (otherwise, we’ll see every debug container all at once), so we call hide() on the containerNode. Finally, we emit the debug_container_registered signal, so anything that wants to listen for that will know when a debug container is registered, and which one it is.

I have not needed to make use of this signal yet in my personal use of the debugging system, but it seems like a potentially useful thing to expose, so it makes sense to go ahead and do so.

Now that we’ve implemented the register_debug_container() function, it’s time to take a closer look at the DebugTabs node and make it work.

DebugTabs

The Tabs node in Godot is a basic tabs implementation. It does no view switching by itself; instead, when we switch between tabs, a signal is fired indicating which tab was switched to, and it’s up to our code to listen for that signal and respond to it. We’re going to use this functionality to change which debug container is the one being shown in DebugLayer.

Godot does provide a TabsContainer node, which would implement both the tabs and view switching. However, since it is a single node, if you ignore mouse events (as we mentioned needing to add for DebugContainer), then you can’t click on the tabs. If you leave the node able to capture mouse events, it will prevent interacting with the game when the debug interface is open. Thus, I’ve opted to just use the Tabs node and implement view switching manually.

The code to implement the view switching is rather simple:


func _ready() -> void:
  # ...existing code
  debugTabs.connect('tab_changed', self, '_on_Tab_changed')


func _on_Tab_changed(tab_index) -> void:
  var tab_name = debugTabs.get_tab_title(tab_index)
  var containerNode = _debug_containers[tab_name]
  _debugContainer.hide()
  _debugContainer = containerNode
  _debugContainer.show()

During _ready(), we connect to the tab_changed signal for debugTabs and provide an _on_Tab_changed() callback. In the callback, we get the name of the tab (based on the tab_index provided as the callback function’s argument), and use that name to find the registered debug container with matching name. We then hide the currently-visible debug container, switch the _debugContainer variable to be the upcoming containerNode, and then make that debug container visible.

Updating Widgets

We’re still missing one important functionality: sending data to update our debug widgets. Since we moved our previous implementation of update_widget() into the DebugContainer node, we’ll need to create a new version of update_widget() that determines which debug container the widget data should be sent to.


# Sends data to the debug container specified in widget_path.
# API: container_name:widget_name.widget_keyword
func update_widget(widget_path: String, data = null) -> void:
  var split_keyword = widget_path.split(':')
  if split_keyword.size() == 1:
    push_error('DebugLayer.update_widget(): No container name was specified. (' + widget_path + ', ' + str(data) + ')')
    return

  var container_name = split_keyword[0]
  if not _debug_containers.has(container_name):
    push_error('DebugLayer.update_widget(): Container with name "' + container_name + '" is not registered.')
    return

  var containerNode = _debug_containers[container_name]
  widget_path = split_keyword[1]
  containerNode.update_widget(widget_path, data)

Notice that the arguments are still the same: we’re passing in a widget_path and data. However, we need a way to indicate which debug container has the debug widget we want to update.

To do this, we’re going to modify the widget_path API slightly. Instead of starting the string with the name of the debug widget, we’ll start with the name of the debug container, and delimit it with a colon, :.

We implement this in code by splitting the widget_path string on said colon and verifying that there was indeed a debug container name passed in. If no container name was provided, then we show an error and return without doing anything further; we do the same if the provided debug container’s name doesn’t exist in our dictionary of registered debug containers. If all is valid, then we get the specified debug container and call its update_widget() function, passing in the other half of our split string (aka the original widget_name.widget_keyword API), as well as data.

At this point, we’re almost ready to run the test scene to try our changes, but there’s something we need to do first: modify our test scene to support the changes we’ve made to our Debug API.

Adding a DebugContainer to the Test Scene

Let’s go straight to our TestScene scene and add one of our new DebugContainer nodes; name it “TestDebugContainer”. As a child of that, add a DebugTextList debug widget with the name “TextList1”. Finally, go to TestScene.gd and change our call to Debug.update_widget() to incorporate our new syntax for specifying the debug container in the widget_path.


func _process(_delta) -> void:
  # ...existing code
  elif test_ct == 900:
    Debug.update_widget('TestDebugContainer:TextList1.remove_label', { 'name': 'counter' })
  elif test_ct < 900:
    Debug.update_widget('TestDebugContainer:TextList1.add_label', { 'name': 'counter', 'value': str(test_ct) })

Now we can run the test scene and see our changes in action! If you press the debug toggle key combination we defined earlier (Shift + `), you should be able to see the same counting text that we saw before. Additionally, you should be able to see the tab we just added, titled "TestDebugContainer".

If that's what you see, good job! If not, review the tutorial (and perhaps the repo code) to try and identify where things went wrong.

Testing with Multiple Debug Containers

That said, these are things we've seen before (aside from the tab). We made these changes to support being able to show different debugging views via multiple debug containers. Let's go ahead and add another one!

Duplicate the TestDebugContainer node (which will create a copy of both that node and the child debug widget; the TestDebugContainer node will be automatically named "TestDebugContainer2"), then go to TestScene.gd and add two new calls to Debug.update_widget() as shown below:


# ...existing code
  elif test_ct == 900:
    Debug.update_widget('TestDebugContainer:TextList1.remove_label', { 'name': 'counter' })
    Debug.update_widget('TestDebugContainer2:TextList1.remove_label', { 'name': 'counter' })
  elif test_ct < 900:
    Debug.update_widget('TestDebugContainer:TextList1.add_label', { 'name': 'counter', 'value': str(test_ct) })
    Debug.update_widget('TestDebugContainer2:TextList1.add_label', { 'name': 'counter', 'value': str(round(test_ct / 10)) })

As you can see, we're simply changing the widget_path to request TestDebugContainer2 instead of TestDebugContainer. To keep the test simple, our second call is showing the same test_ct variable, but divided by ten and rounded to the nearest integer.

That's it! No, seriously! Go ahead and run the scene again, and everything should "just work". You'll see two tabs, one named "TestDebugContainer" and the other named "TestDebugContainer2". Switching between them will alternate between showing the original counter and the rounded version.

But wait, there's more! We can add these debug containers anywhere in our scene structure, and as long as those scenes are part of the currently-running scene tree they'll register themselves to our debugging interface.

To test this, let's create a quick child scene to add to our test scene. Create a new scene called "TestChild" (based on Node), then add a button with text "Test Button" and place it near the top-center of the child scene. Add a DebugContainer with DebugTextList child to TestChild, and make sure you rename them to "TestDebugContainer2" and "TextList1" (to match the widget_path we've defined in the TestScene.gd script). Instance TestChild into TestScene and remove the TestDebugContainer2 node that was in TestScene.

Run the test scene, and you get exactly the same result as before. You can see both the tabs, and switch between them with ease. The only difference is that one debug container originated in TestScene, and the other in TestChild.

If you see the TestDebugContainer2 tab, but not the counter, that means you forgot to make the debug node names and the widget_key string match, so you're not actually sending updates to the correct location.

Fixing One Last Bug

Before we get too hyped with excitement, however, there is a bug that we need to take care of. Run the test scene, open the debugging interface, and hover over the button we added to the TestChild scene. Nothing seems to happen, right? Now close the debugging interface and hover over the button again. This time, it lights up, indicating that it's receiving mouse events. That means something in our debugging interface is intercepting mouse events.

Fortunately, this is a simple fix: we just need to go to the DebugLayer scene and change the mouse_filter properties for DebugUIContainer, VBoxContainer, and DebugContentContainer to MOUSE_FILTER_IGNORE (shown as just Ignore in the editor interface). Do not, however, change the mouse_filter property for DebugTabs, or you may find yourself unable to click on the tabs at all!

Once you've made those changes, run the test scene again. This time, you should be able to trigger the button hover state when the debug interface is open.

Congratulations!

We now have DebugContainer nodes, which we can add wherever we want, and add whatever debug widgets we want to them, using the tabbed interface to switch between whichever debugging views we want to see. And best of all, it's simple to add these debug containers and widget as we need them, whether for temporarily reporting data or for permanent display of debugging information.

With these things, you have the essentials needed to build on this debugging system and make it your own. Create widgets that show you the information that you need to know. As shown in this tutorial, it's easy to make a new debug widget, and just as easy to register it to the debugging system. Using this system has definitely made my game development much easier, and I hope the same will be true for you!

If you want to see the code as it was at the end of this part, check out the tutorial-part-3 branch in the Github repo.

Creating a Debugging Interface in Godot (Part 2)

Welcome to Part 2 of my tutorial for creating a debugging interface in Godot! In Part 1, we created the base for our debugging system. If you haven’t read that part, you should do so now, because the rest of the tutorial series will be building atop it. Alternatively, if you just want the code from the end of Part 1, you can check out the tutorial-part-1 branch in the Github repo.

At this point, we have the base of a debugging system, but that’s all it is: a base. We need to add things to it that will render the debugging information we want to show, as well as an API to DebugLayer that is responsible for communicating this information.

We’ll do this through “debug widgets”. What’s a debug widget? It’s a self-contained node that accepts a set of data, then displays it in a way specific to that individual widget. We’ll make a base DebugWidget node, to provide common functionalities, then make other debug widgets extend that base that implement their custom functionalities on top of the base node.

Alright, enough high-level architecture talk. Let’s dive in and make these changes!

Creating the Base DebugWidget

To get started, we want a place to store our debug widgets. To that end, make a new directory in _debug, called widgets. In this new widgets directory, create a new script called DebugWidget.gd, extending MarginContainer.


# Base class for nodes that are meant to be used with the DebugLayer system.
class_name DebugWidget
extends MarginContainer

Note the custom class_name. This is important, because later on we’ll be using it to check whether a given node is a debug widget.

You may need to reload your Godot project to ensure that the custom class_name gets registered.

Next, we’re going to add something called “widget keywords”:


# Abstract method which must be overridden by the inheriting debug widget.
# Returns the list of widget keywords. Responses to multiple keywords should be provided in _callback.
func get_widget_keywords() -> Array:
  push_error("DebugWidget.get_widget_keywords(): No widget keywords have been defined. Did you override the base DebugWidget.get_widget_keywords() method?")
  return []

This function will be responsible for returning a debug widget’s widget keywords. What are widget keywords, though?

To give a brief explanation, widget keywords are the way we’re going to expose what functionalities this debug widget provides to the debugging system. When we want to send data to a widget, the debugging system will search through a list of stored widget keywords, and if it finds one matching the one we supply in the data-sending function, it will run a callback associated with that widget keyword.

If that doesn’t make much sense right now, don’t worry. As you implement the rest of the flow, it should become clearer what widget keywords do.

One thing to note about the code is that we’re requiring inheriting classes to override the method. This is essentially an implementation of the interface pattern (since GDScript doesn’t provide an official way to do interfaces).

Let’s add a couple more functions to DebugWidget.gd:


# Abstract method which must be overridden by the inheriting debug widget.
# Handles the widget's response when one of its keywords has been invoked.
func _callback(widget_keyword, data) -> void:
  push_error('DebugWidget._callback(): No callback has been defined. (' + widget_keyword + ', ' + data + ')')


# Called by DebugContainer when one of its widget keywords has been invoked.
func handle_callback(widget_keyword: String, data) -> void:
  _callback(widget_keyword, data)

handle_callback() is responsible for calling the _callback() function. Right now, that’s all it does. We’ll eventually also do some pre-callback validation in this function, but we won’t get into that just yet.

_callback() is another method that we explicitly want the inheriting class to extend. Essentially, this is what will be run whenever something uses one of the debug widget’s keywords. Nothing is happening there right now; all the action is going to be in the inheriting debug widgets.

That’s it for the base DebugWidget. Time to extend that base!

Creating the DebugTextList DebugWidget

Remember that DebugLabel that was discussed at the beginning of the article? Having a text label that you can update as needed is a useful thing for a debugging system to have. Why stop with a single label, though? Why not create a debug widget that is a list of labels, which you can update with multiple bits of data?

That’s the debug widget we’re going to create. I call it the DebugTextList.

I prefix debug widget nodes with Debug, to indicate that they are only meant to be used for debugging purposes. It also makes it easy to find them when searching for scenes to instance.

Create a directory in widgets called TextList, then create a DebugTextList scene (not script). If you’ve registered the DebugWidget class, you can extend the scene from that; otherwise, this is the point where you’ll need to reload the project in order to get access to that custom class.

Why create it as a scene, and not as another custom node? Really, it’s simply so that we can create the node tree for our debug widget using the editor’s graphical interface, making it simpler to understand. It’s possible to add the same child nodes through a script, and thereby make it possible to make the DebugTextList a custom node. For this tutorial, however, I’m going to keep using the scene-based way, for simplicity.

Alright, let’s get back on with the tutorial.

Add a VBoxContainer child node to the DebugTextList root node. Afterwards, attach a new script to the DebugTextList scene, naming it DebugTextList.gd, and have it extend DebugWidget. Replace the default script text with the following code:


const WIDGET_KEYWORDS = {
  'ADD_LABEL': 'add_label',
  'REMOVE_LABEL': 'remove_label'
}


onready var listNode = $VBoxContainer

listNode is a reference to the VBoxContainer. We also have defined a const, WIDGET_KEYWORDS, which will define the widget keywords this debug widget supports. Technically, you could just use the keyword’s strings where needed, rather than define a const, but using the const is easier, as you can see below.


# Handles the widget's response when one of its keywords has been invoked.
func _callback(widget_keyword: String, data) -> void:
  match widget_keyword:
    WIDGET_KEYWORDS.ADD_LABEL:
      add_label(data.name, str(data.value))
    WIDGET_KEYWORDS.REMOVE_LABEL:
      remove_label(data.name)
    _:
      push_error('DebugTextList._callback(): widget_keyword not found. (' + widget_keyword + '", "' + name + '", "' + str(WIDGET_KEYWORDS) + '")')


# Returns the list of widget keywords.
func get_widget_keywords() -> Array:
  return [
    WIDGET_KEYWORDS.ADD_LABEL,
    WIDGET_KEYWORDS.REMOVE_LABEL
  ]

Notice that we’re overriding both _callback() and get_widget_keywords(). The latter returns the two widget keywords we defined in the const, while the former performs a match check against the widget_keyword argument to see if it matches one of our two defined keywords, running a corresponding function if so. By using the const to define our widget keywords, we’ve made it easier to ensure that the same values get used in all the places needed in our code.

match is Godot’s version of implementing the switch/case pattern used in other languages (well, it’s slightly different, but most of the time you can treat it as such). You can read more about it here. The underscore in the match declaration represents the default case, or what happens if widget_keyword doesn’t match our widget keywords.

Let’s go ahead and add the two response functions now: add_label() and remove_label(). We’ll also add a helper function that is used by both, _find_child_by_name().


# Returns a child node named child_name, or null if no child by that name is found.
func _find_child_by_name(child_name: String) -> Node:
  for child in listNode.get_children():
    if 'name' in child and child.name == child_name:
      return child

  return null


# Adds a label to the list, or updates label text if label_name matches an existing label's name.
func add_label(label_name: String, text_content: String) -> void:
  var existingLabel = _find_child_by_name(label_name)
  if existingLabel:
    existingLabel.text = text_content
    return

  var labelNode = Label.new()
  labelNode.name = label_name
  labelNode.text = text_content
  listNode.add_child(labelNode)


func remove_label(label_name) -> void:
  var labelNode = _find_child_by_name(label_name)
  if labelNode:
    listNode.remove_child(labelNode)

_find_child_by_name() takes a given child_name, loops through the children of listNode to see if any share that name, and returns that child if so. Otherwise, it returns null.

add_label() uses that function to see if a label with that name already exists. If the label exists, then it is updated with text_content. If it doesn’t exist, then a new label is created, given the name label_name and text text_content, and added as a child of listNode.

remove_label() looks for an existing child label, and removes it if found.

With this code, we now have a brand-new debug widget to use for our debugging purposes. It’s not quite ready for use to use, yet. We’re going to have to make changes to DebugLayer in order to make use of these debug widgets.

Modifying DebugLayer

Back in Part 1 of this tutorial, we made the DebugLayer scene a global AutoLoad, to make it accessible from any part of our code. Now, we need to add an API to allow game code to send information through DebugLayer to the debug widgets it contains.

Let’s start by adding a dictionary for keywords that DebugLayer will be responsible for keeping track of.


# The list of widget keywords associated with the DebugLayer.
var _widget_keywords = {}

Next, we’ll add in the ability to “register” debug widgets to the DebugLayer.


func _ready():
  # ...existing code
  _register_debug_widgets(self)


# Go through all children of provided node and register any DebugWidgets found.
func _register_debug_widgets(node) -> void:
  for child in node.get_children():
    if child is DebugWidget:
      register_debug_widget(child)
    elif child.get_child_count() > 0:
      _register_debug_widgets(child)


# Register a single DebugWidget to the DebugLayer.
func register_debug_widget(widgetNode) -> void:
  for widget_keyword in widgetNode.get_widget_keywords():
    _add_widget_keyword(widget_keyword, widgetNode)

In our _ready() function, we’ll call _register_debug_widgets() on the DebugLayer root node. _register_debug_widgets() loops through the children of the passed-in node (which, during the ready function execution, is DebugLayer). If any children with the DebugWidget class are found, it’ll call register_debug_widget() to register it. Otherwise, if that child has children, then _register_debug_widgets() is called on that child, so that ultimately all the nodes in DebugLayer will be processed to ensure all debug widgets are found.

register_debug_widget(), meanwhile, is responsible for looping through the debug widget’s keywords (acquired from calling get_widget_keywords()) and adding them to the keywords dictionary via _add_widget_keyword(). Note that this function I chose to not mark as “private” (by leaving off the underscore prefix). There may be reason to allow external code to register a debug widget manually. Though I personally haven’t encountered this scenario yet, the possibility seems plausible enough that I decided to not indicate the function as private.

Let’s add the _add_widget_keyword() function now:


# Adds a widget keyword to the registry.
func _add_widget_keyword(widget_keyword: String, widget_node: Node) -> void:
  var widget_node_name = widget_node.name if 'name' in widget_node else str(widget_node)

  if not _widget_keywords.has(widget_node_name):
    _widget_keywords[widget_node_name] = {}

  if not _widget_keywords[widget_node_name].has(widget_keyword):
    _widget_keywords[widget_node_name][widget_keyword] = widget_node
  else:
    var widget = _widget_keywords[widget_node_name][widget_keyword]
    var widget_name = widget.name if 'name' in widget else str(widget)
    push_error('DebugLayer._add_widget_keyword(): Widget keyword "' + widget_node_name + '.' + widget_keyword + '" already exists (' + widget_name + ')')
    return

That looks like a lot of code, but if you examine it closely, you’ll see that most of that code is just validating that the widget data we’re working with was set up correctly. First, we get the name of widget_node (aka the name as entered in the Godot editor). If that node’s name isn’t already a key in our _widget_keywords dictionary, we add it. Next, we check to see if the widget_keyword already exists in the dictionary. If it doesn’t, then we add it, setting the value equal to the widget node. If it does exist, we push an error to Godot’s error console (after some string construction to make a developer-friendly message).

Interacting with Debug Widgets

At this point, we can register debug widgets so that our debugging system is aware of them, but we still don’t have a means of communicating with the debug widgets. Let’s take care of that now.


# Sends data to the widget with widget_name, triggering the callback for widget_keyword.
func update_widget(widget_path: String, data) -> void:
  var split_widget_path = widget_path.split('.')
  if split_widget_path.size() == 1 or split_widget_path.size() > 2:
    push_error('DebugContainer.update_widget(): widget_path formatted incorrectly. ("' + widget_path + '")')

  var widget_name = split_widget_path[0]
  var widget_keyword = split_widget_path[1]

  if _widget_keywords.has(widget_name) and _widget_keywords[widget_name].has(widget_keyword):
    _widget_keywords[widget_name][widget_keyword].handle_callback(widget_keyword, data)
  else:
    push_error('DebugContainer.update_widget(): Widget name and keyword "' + widget_name + '.' + widget_keyword  + '" not found (' + str(_widget_keywords) + ')')

Our API to interact with debug widgets will work like this: we’ll pass in a widget_path string to update_widget(), split with a . delimiter. The first half of the widget_path string is the name of the widget we want to send data to; the second half is the widget keyword we want to invoke (and thereby tell the widget what code to run).

update_widget() performs string magic on our widget_path, makes sure that we sent in a properly-formatted string and that the widget and widget keyword is part of _widget_keywords. If things were sent correctly, the widget node reference we stored during registration is accessed, and the handle_callback() method called, passing in whatever data the widget node expects. If something’s not done correctly, we alert the developer with error messages and return without invoking anything.

That’s all we need to talk to debug widgets. Let’s make a test to verify that everything works!

Currently, our TestScene scene doesn’t have an attached script. Go ahead and attach one now (calling it TestScene.gd) and add the following code to it:


extends Node

var test_ct = -1

func _process(_delta) -> void:
  test_ct += 1
  if test_ct >= 1000:
    test_ct = -1
  elif test_ct >= 900:
    Debug.update_widget('TextList1.remove_label', { 'name': 'counter' })
  else:
    Debug.update_widget('TextList1.add_label', { 'name': 'counter', 'value': str(test_ct % 1000) })

This is just a simple counter functionality, where test_ct is incremented by 1 each process step. Between 0-899, Debug.update_widget() will be called, targeting a debug widget named “TextList1” and the add_widget widget keyword. For the data we’re passing the widget, we send the name of the label we want to update, and the value to update to (which is a string version of test_ct). Once test_ct hits 900, however, we want to remove the label from the debug widget, which we accomplish through another Debug.update_widget() call to TextList1, but this time using the remove_label widget keyword. Finally, once test_ct hits 1000, we reset it to 0 so it can begin counting up anew.

If you run the test scene right now, though, nothing happens. Why? We haven’t added TextList1 yet! To do that, go to the DebugLayer scene, remove the existing test label (that we created during Part 1), and instance a DebugTextList child, naming it TextList1. Now, if you run the test scene and open up the debugging interface (with Shift + `, which we set up in the previous part), you should be able to see our debug widget, faithfully reporting the value of test_ct each process step.

If that’s what you see, congratulations! If not, review the tutorial code samples and try to figure out what might’ve been missed.

One More Thing

There’s an issue that we’re not going to run into as part of this tutorial series, but that I’ve encountered during my own personal use of this debugging system. To save future pain and misery, we’re going to take care of that now.

Currently, our code for debug widgets always assumes that we’re going to pass in some form of data for it to process. But what if we want a debug widget that doesn’t need additional data? As things stand, because debug widgets assume that there will be data, the code will crash if you don’t pass in any data.

To fix that, we’ll need to add a couple of things to the base DebugWidget class:


# Controls if the widget should allow invocation without data.
export(bool) var allow_null_data = false


# Called by DebugContainer when one of its widget keywords has been invoked.
func handle_callback(widget_keyword: String, data = null) -> void:
  if data == null and not allow_null_data:
    push_error('DebugWidget.handle_callback(): data is null. (' + widget_keyword + ')')
    return
  
  _callback(widget_keyword, data)

We’ve added an exported property, allow_null_data, defaulting it to false. If a debug widget implementation wants to allow null data, it needs to set this value to true.

handle_callback() has also been modified. Before it runs _callback(), it first checks to see if data is null (which it will be if the second argument isn’t provided, because we changed the argument to default to null). If data is null, and we didn’t allow that, we push an error and return without running callback(). That prevents the game code crashing because of null data, and it also provides helpful information to the developer. If there is data, or the debug widget explicitly wants to allow null data, then we run _callback(), as normal.

That should take care of the null data issue. At this point, we’re golden!

Congratulations!

Our debugging system now supports adding debug widgets, and through extending the base DebugWidget class we can create whatever data displays we want. DebugTextList was the first one we added, and hopefully it should be easy to see how simple it is to add other debug widgets that show our debugging information in whatever ways we want. If we want to show more than one debug widget, no problem, just instance another debug widget!

Even though all this is pretty good, there are some flaws that might not be immediately apparent. For instance, what happens if we want to implement debug widgets that we don’t want to be shown at the same time, such as information about different entities in our game? Or what if we want to keep track of so much debugging information that we clutter the screen, making it that much harder to process what’s going on?

Wouldn’t it be nice if we could have multiple debug scenes that we could switch between at will when the debug interface is active? Maybe we’d call these scenes “containers”. Or, even better, a DebugContainer.

That’s what we’ll be building in the next part of this tutorial!

If you want to see the complete results from this part of the tutorial, check the tutorial-part-2 branch of the Github repo.

Creating a Debugging Interface in Godot (Part 1)

At some point during the development of a game, you need to be able to show information that helps you debug issues in your game. What kind of information? That really depends on your game and what your needs are. It could be as simple as printing some text that shows the result of an internal calculation, or it could be as fancy as a chart showing the ratio of decisions being made by the game’s artificial intelligence.

There are different kinds of debugging needed as well. Sometimes, you need something temporary to help you figure out why that function you just wrote isn’t behaving the way you expect it to. Other times, you want an “official” debugging instrument that lives on as a permanent display in your game’s debugging interface.

How does one go about building a debugging system, however? In this blog tutorial, we’ll build a debugging system in the Godot game engine, one that is flexible, yet powerful. It’s useful both for temporary debugging and a long-term debugging solution. I use this system to provide a debugging interface for my own games, and I want to share how to make one like it in the hopes that it helps you in your own game development efforts.

This will be a multiple-part series. At the end of it, you’ll have the root implementation of the debugging system, and knowledge on how to extend it to suit your debugging purposes.

If you want to see the end result, you can download the sample project from Github: https://github.com/Jantho1990/Sample-Project-Debug-Interface

Existing Debugging Tools in Godot

Godot comes with a number of functionalities that are useful for debugging. The most obvious of these is the trusty print() function. Feed it a string, and that string will get printed out to the debugging console during game runtime. Even when you have a debugging system in place, print() is still useful as part of your toolset for temporary debugging solutions. That said, nothing you show with print() is exposed to an in-game interface, so it’s not very useful if you want to show debugging information on a more permanent basis. Also, if you need to see information that updates on every frame step, the debugging console will quickly be overwhelmed with a flood of printed messages, to the point where Godot will bark at you about printing too many messages. Thus, while print() definitely has its uses, we are still in need of something more robust for long-term debugging solutions.

One way I solved this problem in the past is by creating a DebugLabel node, based on a simple Label. This node would listen for a signal, and when said signal was received it would set its text value to whatever string was sent to it. The code looked something like this:


# DebugLabel
extends Label
export(String) var debug_name = "DebugLabel1"

func _ready() -> void:
  GlobalMessenger.listen(debug_name, self, "on_Debug_message_received")

func _on_Debug_message_received(data):
  text = str(data)

This solution also depended on a separate GlobalMessenger system that functions as a global way of passing information. But that system is a tale for another day.

This gave me a solution for printing debugging information that updated on every process step, without overloading the debugging console. While this little component was useful, it had its drawbacks. Every call to print a message to the DebugLabel would overwrite the previous value, so if I needed to show more than one piece of updating information, I would have to create multiple DebugLabel nodes. It wouldn’t take long for my scenes to be cluttered with DebugLabel nodes. Also, this still wasn’t part of a debugging system. If there was a DebugLabel, it’d show, regardless of whether you needed to view debugging information or not. Thus, while this node also served a valuable purpose, it was not enough for a proper debugging solution.

So what does a debugging solution need? It needs a way to conditionally show and hide debugging information, depending on whether such information needs to be viewed. It also needs to expose a method for game code to interact with it to pass in debugging information. There are many possible kinds of information that we’d want to see, so this interaction method must support being able to accept multiple kinds of information. Finally, there should be an easy way of creating debugging scenes to organize the information in whatever ways make sense to those that view the debugging information.

With that high-level information, let’s start by tackling the first part of that paragraph: conditionally showing and hiding the debugging information.

Creating a Test Scene

But before we start working on the debugging system proper, we should have a test scene that exists to help us test that what we’re creating actually works. It doesn’t need to be anything fancy.

While this part of the tutorial is optional, the tutorial series will be assuming the existence of this test scene. If you choose not to make it, then you’ll have to figure out how to test the debugging system’s code in a different way.

Create a scene, and have it extend Node. Let’s call it “TestScene”. In TestScene, add a Line2D node, make it whatever color you want (I chose red), and set the points to make it some easily-visible size (I set mine to [-25, 0], [25, 0] to make a 50px-long horizontal line). Move the Line2D somewhere near the center of the scene; it doesn’t have to be exact, as long as it isn’t too close to the top or edge of the game window. Finally, click the triangle button to run Godot’s main scene; since we don’t have one defined, Godot will pop up an interface that will allow you to make TestScene the default scene, which you should do.

You can alternatively just run this individual scene without making it the main scene; I have chosen to make it the main scene in this tutorial purely out of convenience.

This is what my version of the test scene looks like after doing these things:

Now that we have a test scene, let’s get to building the debugging system proper.

Creating the DebugLayer Global

We need a way to interact with the debugging interface from anywhere in our game code. The most effective way to do this is to create a global scene that it loaded as part of the AutoLoads. This way, any time our game or a scene in our game is run, the debugging system will always be available.

Start by creating a new scene, called DebugLayer, and have it extend the CanvasLayer node. Once the scene is created, go to the CanvasLayer node properties and set the layer property to 128.

That layer property tells Godot what order it should render CanvasLayer nodes in. The highest value allowed for that property is 128, and since we want debugging information to be rendered atop all other information, that’s what we’ll set our DebugLayer to.

For more information on how CanvasLayer works, you can read this documentation page.

Now, create a script for our node, DebugLayer.gd. For now, we’re not going to add anything to it, we just want the script to be created. Make sure it, as well as the DebugLayer scene, are saved to the directory _debug (which doesn’t exist yet, so you’ll need to create it).

Finally, go to Project -> Project Settings -> AutoLoad, and add the DebugLayer scene (not the DebugLayer.gd script) as an AutoLoad, shortening its name to Debug in the process. This is how we’ll make our debugging interface accessible from all parts of our game.

Yes, you can add scenes to AutoLoad, not just scripts. I actually discovered that thanks to a GDQuest tutorial on their Quest system, and have since used that pattern for a wide variety of purposes, including my debugging system.

To verify that our DebugLayer shows in our game, add a Label child to the DebugLayer scene, then run the game. You should be able to see that Label when you run the game, proving that DebugLayer is being rendered over our TestScene.

Toggle Debug Visibility

This isn’t particularly useful yet, though. We want to control when we show the debugging information. A good way to do this is to designate a key (or combination of keys) that, when pressed, toggles the visibility of DebugLayer and any nodes it contains.

Open up the project settings again, and go to Input Map. In the textbox beside Action:, type “toggle_debug_interface” and press the Add button. Scrolling down to the bottom of the Input Map list will reveal our newly-added action at the bottom.

Now we need to assign some kind of input that will dispatch this toggle_debug_interface action. Clicking the + button will allow you to do this. For this tutorial, I’ve chosen to use Shift + ` as the combination of keys to press (Godot will show ` as QuoteLeft). Once this is done, go ahead and close the project settings window.

It’s time to start adding some code. Let’s go to DebugLayer.gd and add this code:


var show_debug_interface = false


func _ready():
  _set_ui_container_visibility(show_debug_interface)


func _set_ui_container_visibility(boolean):
  visible = boolean

Right away, the editor will show an error on the visible = boolean line. You can confirm the error is valid by running the project and seeing the game crash on that line, with the error The identifier "visible" isn't declared in the current scope. That’s because CanvasLayer doesn’t inherit from the CanvasItem node, so it doesn’t contain a visible property. Therefore, we’ll need to add a node based on Control that acts as a UI container, and it is this node that we’ll toggle visibility for.

CanvasItem is the node all 2D and Control (aka UI) nodes inherit from.

Add a MarginContainer node to DebugLayer, calling it DebugUIContainer. Then, move the test label we created earlier to be a child of the DebugUIContainer. Finally, in DebugLayer.gd, change the visibility target to our new UI container:


onready var _uiContainer = $DebugUIContainer


func _set_ui_container_visibility(boolean):
  _uiContainer.visible = boolean

You may notice that I’m prefixing _uiContainer with an underscore. This is a generally-accepted Godot best practice for identifying class members that are intended to be private, and thus should not be accessed by code outside of that class. I also use camelCase to indicate that this particular variable represents a node. Both are my personal preferences, based on other best practices I’ve observed, and you do not need to adhere to this style of nomenclature for the code to work.

At this point, if you run the test scene, the test label that we’ve added should no longer be visible (because we’ve defaulted visibility to false). That’s only half the battle, of course; we still need to add the actual visibility toggling functionality. Let’s do so now:


func _input(_event):
  if Input.is_action_just_pressed('toggle_debug_interface'):
    show_debug_interface = !show_debug_interface
    _set_ui_container_visibility(show_debug_interface)

_input() is a function Godot runs whenever it detects an input action being dispatched. We’re using it to check if the input action is our toggle_debug_interface action (run in response to our debug key combination we defined earlier). If it is our toggle_debug_interface action, then we invert the value of show_debug_interface and call _set_ui_container_visibility with the new value.

Technically, we could just call the visibility function with the inverted value, but setting a variable exposes to outside code when the debug interface is being shown. While this tutorial is not going to show external code making use of that, it seems a useful enough functionality that we’re going to include it nonetheless.

Run the test scene again, and press Shift + `. This should now reveal our test label within DebugLayer, and prove that we can toggle the debug interface’s visibility. If that’s what happens, congratulations! If not, review the tutorial to try and identify what your implementation did incorrectly.

Congratulations!

We now have the basics of a debugging interface. Namely, we have a DebugLayer scene that will house our debugging information, one that we can make visible or invisible at the press of a couple of keys.

That said, we still don’t have a way of actually adding debugging information. As outlined earlier, we want to be able to implement debugging displays that we can easily reuse, with a simple API for our game code to send debugging information to the debugging system.

To accomplish these objectives, we’ll create something that I call “debug widgets”. How does a debug widget work? Find out in the next part of this tutorial!

You can review the end state of Part 1 in the Github repo by checking out the tutorial-part-1 branch.

Hammertime Prototype – Phase 1 (Download)

Link to download a simple prototype project. Available for Windows only.

Hammertime Prototype Phase 1

Controls:
AWSD = Move/Jump
Right Mouse = Throw Hammer
Right Mouse (while hammer in air) = Teleport to Hammer's location
Left Mouse (while hammer in air) = Create platform
Left Click (on platform) = Select platform
Left Click (anywhere but a platform) = Deselect selected platform
q (while platform selected) = Delete platform
q (no platform selected) = Delete all platforms

If you need a goal, you can try to collect all the tomes. The main point of this prototype, however, is to play around with the movement mechanics.

React Hangman Koji Template Released

If you follow me on Instagram, you probably know that I have been working on a game template for Koji for the past few months. It started out as a portfolio project for me when I was looking for a job, and even after I got the job I decided I wanted to finish it and release it as a template for other Koji users to build their own apps on top of.

Well, today is the day of the first public release! Go play it here: https://withkoji.com/~Jantho1990/react-hangman

It’s intended to be a template, but the base app is fully playable in its own right!

I invite you to play the game and leave a comment on how you felt about it. Any feedback is helpful!